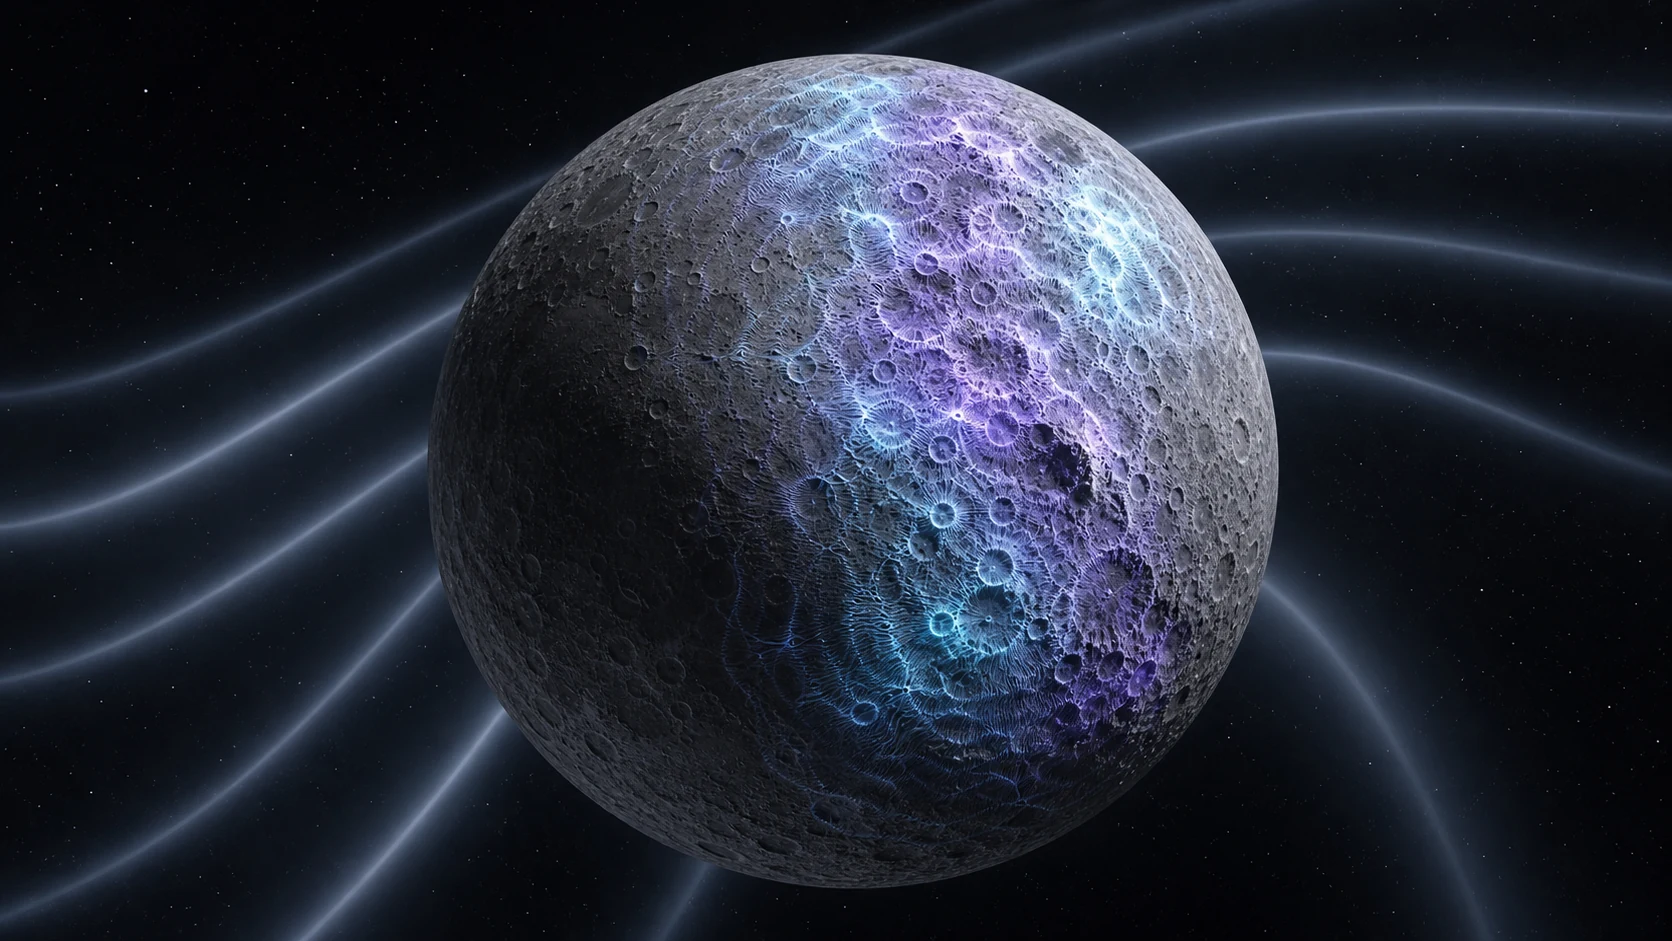
Researchers incorporated real lunar topography and crustal-thickness variations into models of the Moon’s response to gravitational waves. Simulated signals were generally stronger across the thick-crust highlands on the far side. The result can guide seismometer siting and target frequencies, but it remains a numerical and theoretical prediction—not an actual lunar detection of gravitational waves.
Key points
- The study combines two-dimensional spectral-element simulations on a roughly 2-kilometre grid with three-dimensional normal-mode coupling analysis to calculate how real topography and lateral variations in lunar-crust thickness alter the Moon’s response to gravitational waves.
- Band-integrated signals are generally stronger in thick-crust regions by about ten percent. Amplification is most consistent across the far-side highlands, while the thin-crust maria on the near side are generally weaker.
- In some extremely narrow frequency bands, the local displacement-energy ratio reaches or exceeds ten. This compares the realistic model with a spherically symmetric, layered Moon; it is not a measured tenfold increase in the gravitational wave itself.
- The amplification mainly arises from mode mixing caused by an uneven crust: a gravitational wave first excites quadrupole oscillations, then energy is redistributed into mixed higher-order modes.
- Crustal thickness alone cannot determine a site. Basin focusing, the detector’s target band, long low-noise observations and small-scale fractures not yet fully modelled will all affect sensitivity.
When a gravitational wave passes through the Moon, tiny stretches and squeezes of spacetime exert tidal forces on the lunar body, causing extremely weak free oscillations. Lei Zhang, Han Yan, Xian Chen and Jinhai Zhang report in Physical Review Letters that including real topography and crustal-thickness variations in their calculations makes simulated motion systematically stronger in thick-crust regions. The result makes the idea of using the Moon as a natural resonant antenna more concrete and offers siting clues for future lunar gravitational-wave detectors.
Why use the Moon to “listen” for gravitational waves?
Existing ground-based interferometers mainly detect gravitational waves from tens to thousands of hertz, while pulsar timing arrays probe nanohertz scales. Between them, the 0.01-to-1-hertz mid-frequency band still lacks an operating observatory, even though it may contain signals from inspiralling compact binaries, intermediate-mass black-hole mergers, seeds of supermassive black holes and processes in the early universe. Space missions such as LISA, TianQin and Taiji target part of this gap; another approach is to use the resonance of a celestial body itself.
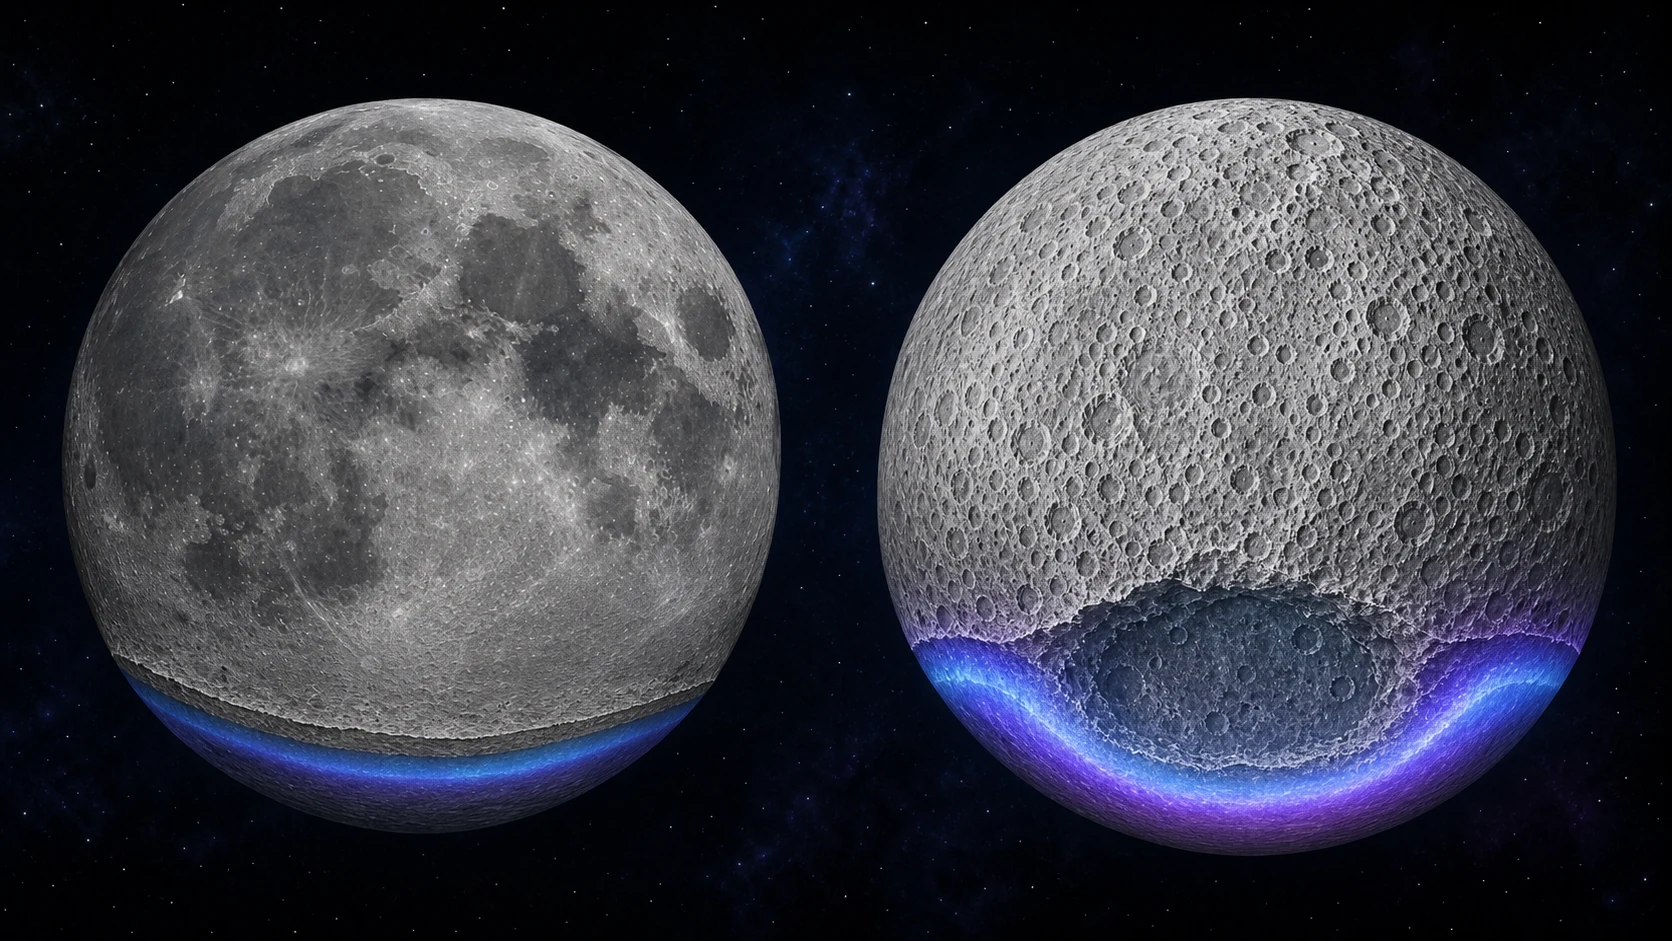
The Moon has no oceans or atmosphere and is far from most ground vibrations caused by human activity, giving it a quieter background than Earth. The quadrupolar tidal force of a gravitational wave can excite the Moon’s l = 2 free oscillations. In principle, sufficiently sensitive seismometers operating for long periods on the lunar surface could measure the resulting displacement. But the real Moon is not a smooth, uniform sphere: the near and far sides have different topography, and crustal thickness varies strongly from place to place. These structures reshape the resonant signal.
Two methods put the real lunar crust into the model
The team used elevation data from the Lunar Reconnaissance Orbiter’s LOLA instrument and a GRAIL crustal model to build a high-resolution two-dimensional model with a grid spacing of about 2 kilometres along a great-circle profile crossing Mare Humboldtianum, Mare Imbrium and the South Pole–Aitken basin. Spectral-element simulations compared the realistic structure with a spherically symmetric, layered Moon and tracked surface-displacement energy up to about 0.2 hertz. A separate three-dimensional normal-mode perturbation calculation examined how low-frequency global modes couple. The two methods operate at different scales, yet produce the same crust-thickness trend where their low-frequency ranges overlap.
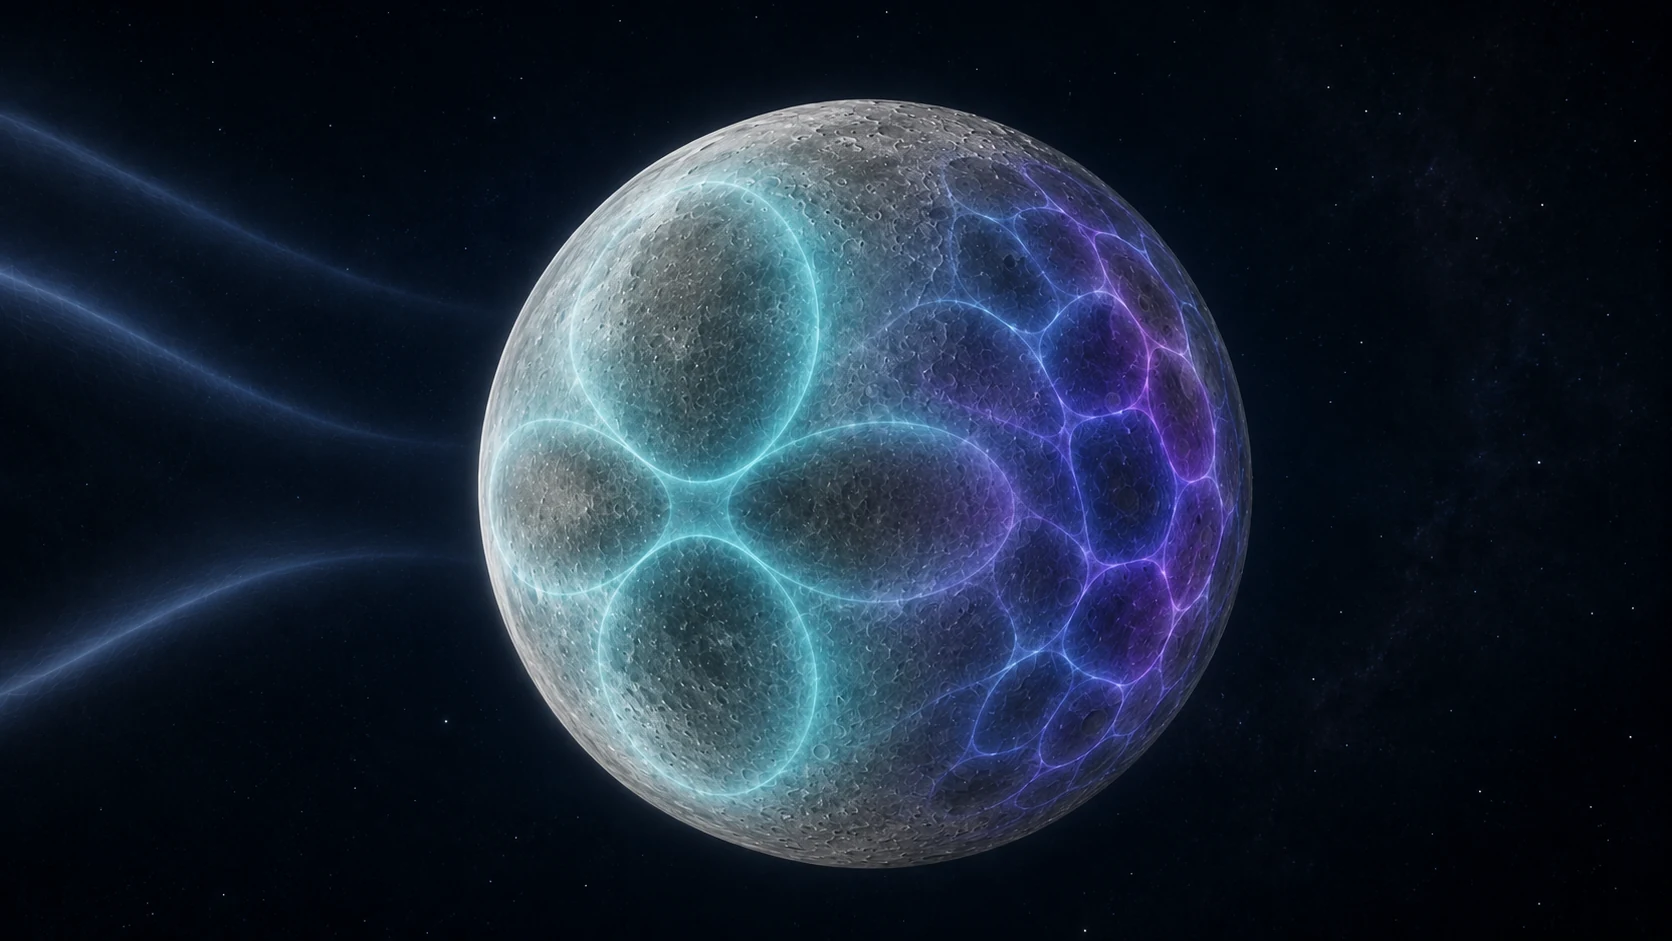
After displacement energy is integrated over a frequency band, simulated signals across thick-crust highlands are generally stronger than in the spherical reference model by roughly ten percent, while thin-crust regions are mostly weaker. The enhancement is most consistent across the far-side highlands, and the near-side maria are usually weaker. In a few extremely narrow bands near 0.1 hertz, the local displacement-energy ratio can reach ten in highlands around the South Pole–Aitken basin. This is a relative ratio between models; it does not mean the Moon amplifies the gravitational wave itself tenfold.
The mechanism is mode mixing. In a perfectly symmetric Moon, gravitational waves couple mainly to l = 2 quadrupole modes. Lateral variations in the crust mix the original modes into new eigenoscillations and redistribute energy into higher-order modes with l > 2. When the calculation retains only the l = 2 component, the global difference is about 4%; the contrast between thick and thin crust becomes much stronger only after higher-order modes are included, supporting mode mixing as the main cause.
The thickest site is not best at every frequency
Crustal thickness dominates the broadband trend, but local topography can change the answer at particular frequencies. Near 0.06 hertz, the simulations show that notches or focusing effects inside basins can produce strong signals even where the crust is thinner. The thick-crust far-side highlands are therefore a useful starting point, but actual seismometer sites must be evaluated point by point against the instrument’s target band and high-resolution structural and topographic models.
Some of the strongest peaks are only about 0.1 millihertz wide. Resolving such narrow structures in a spectrum requires a single observation lasting at least about 10,000 seconds, or roughly 2.8 hours; the paper recommends continuously collecting a day or more of low-noise lunar seismic data. A future array must also use structured correlations between stations to separate the gravitational-wave response from a random, spatially incoherent background of moonquakes.
From a siting guide to a probe of the lunar interior
The work provides a calibration framework for concepts such as the Lunar Gravitational-Wave Antenna (LGWA) and Lunar Laser Interferometer for Gravitational-wave Antenna (LILA): researchers can predict the lunar response at different places and frequencies before designing arrays and analysis methods. Conversely, if a future experiment can precisely match gravitational-wave signals from known celestial events to surface motion, the way lunar structure modifies the modes could help constrain the Moon’s three-dimensional interior. This is a potential application proposed by the study, not a completed measurement of the lunar interior.
For now, the high-resolution spectral-element simulation remains a two-dimensional great-circle profile, and the three-dimensional perturbation calculation truncates higher-order modes. Heterogeneity at kilometre and sub-kilometre scales, pervasive fractures in the lunar megaregolith, and the direction and polarisation of individual gravitational-wave events are not yet fully included. Full three-dimensional simulations, realistic instrument noise and long-term lunar data will determine whether the modelled gain can become a practical observing advantage.