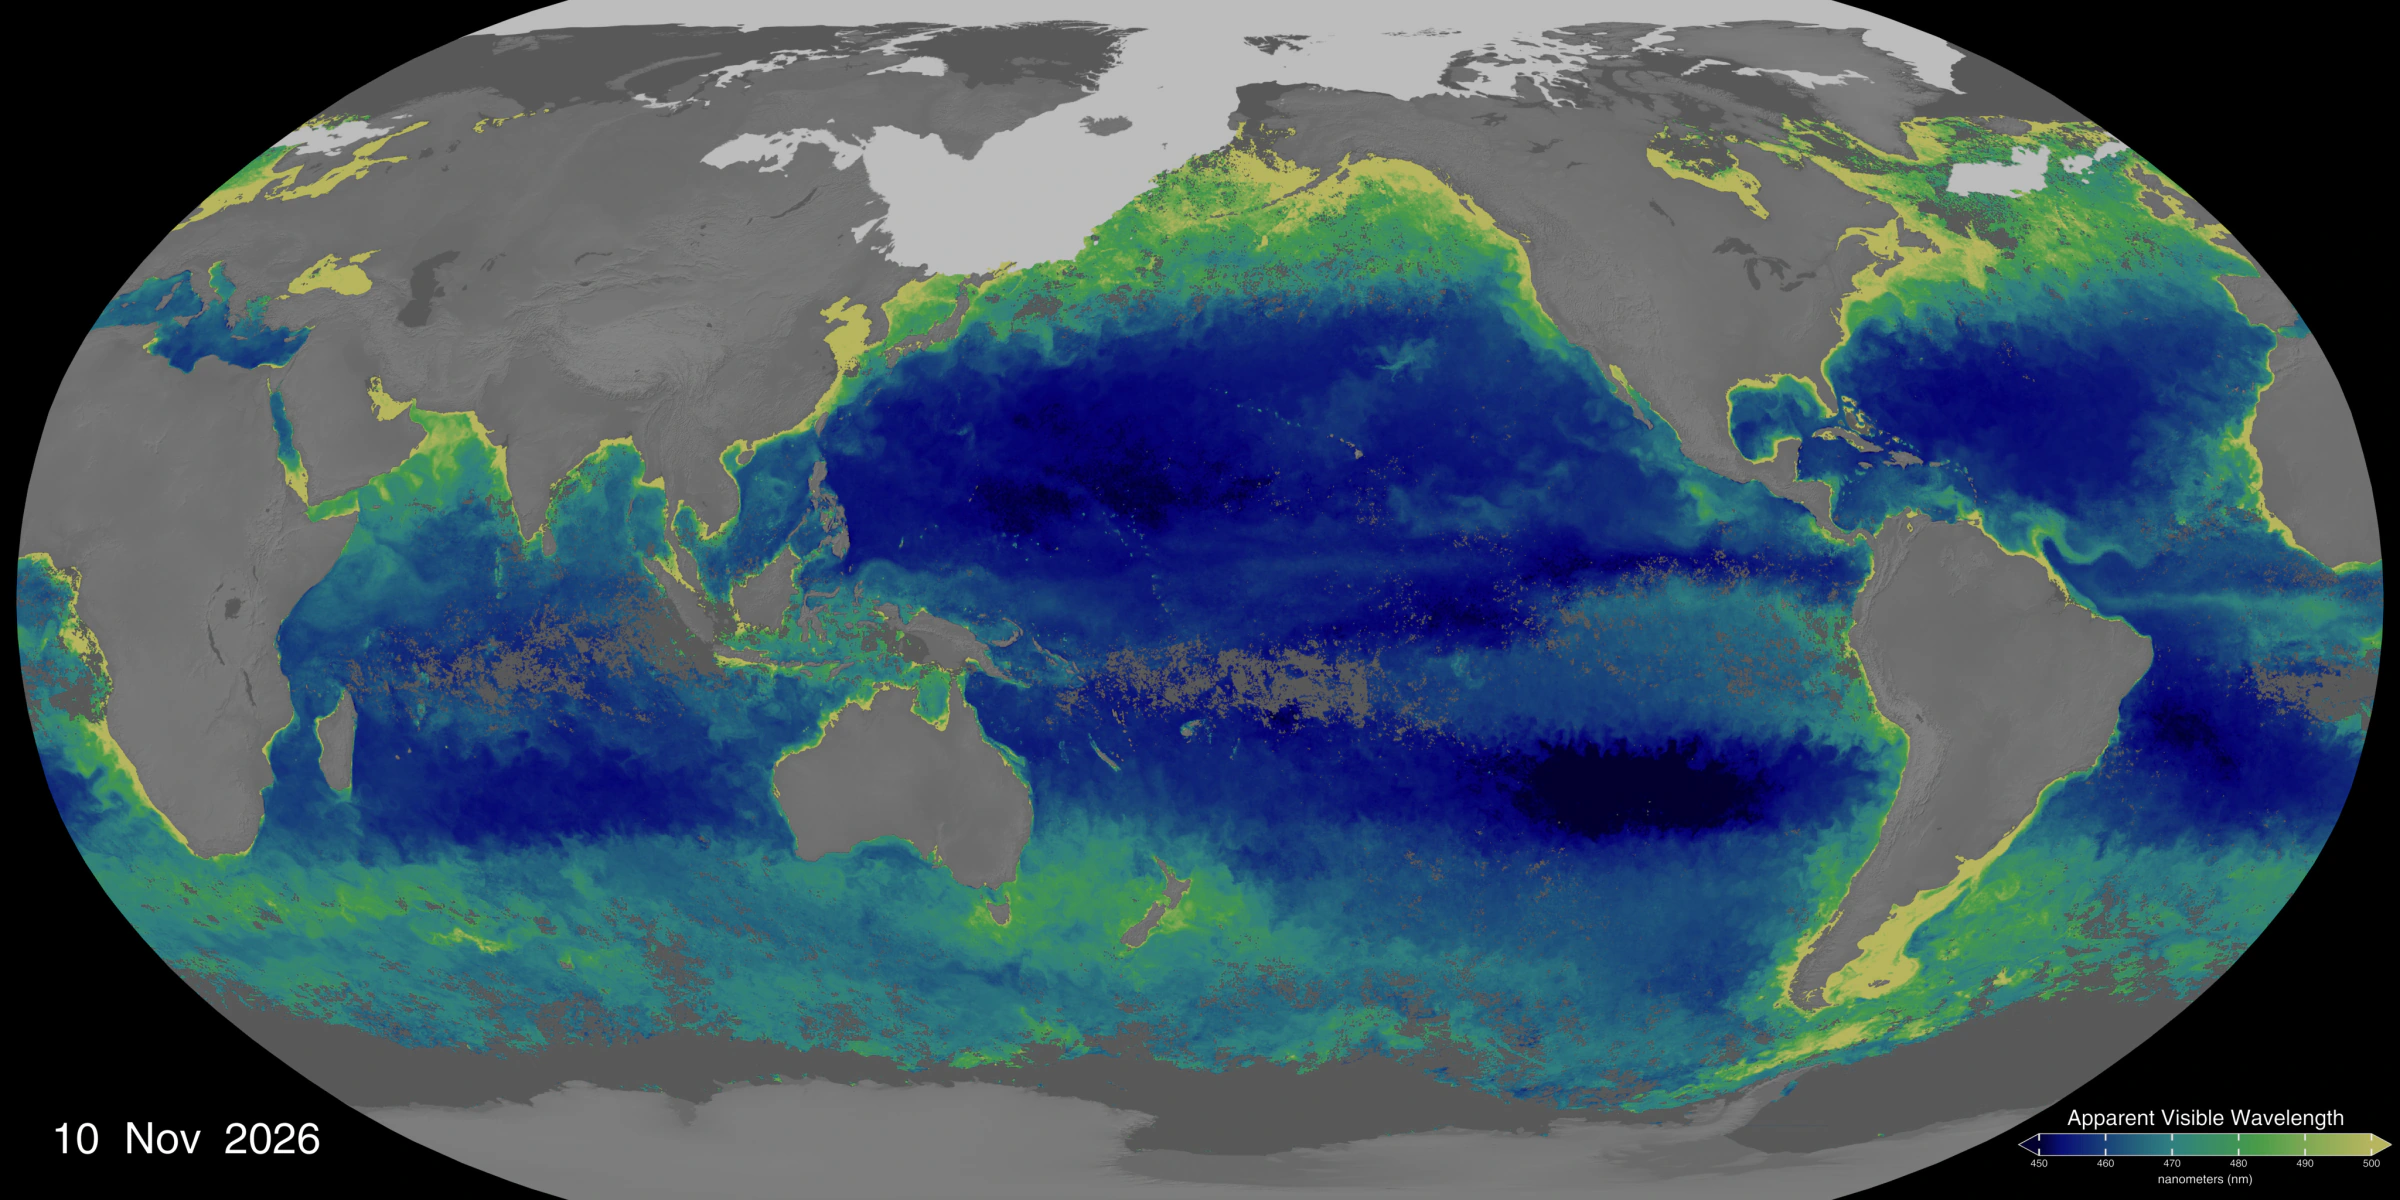
NASA’s global PACE map uses the latest 30 days of satellite observations to show ocean color and provide clues to where phytoplankton are found in surface waters.
Key points
- NASA updates the map daily as observations become available. Each frame covers the latest 30 days.
- The scale shows apparent visible wavelength in nanometers. Phytoplankton and other factors, including sediment, affect ocean color.
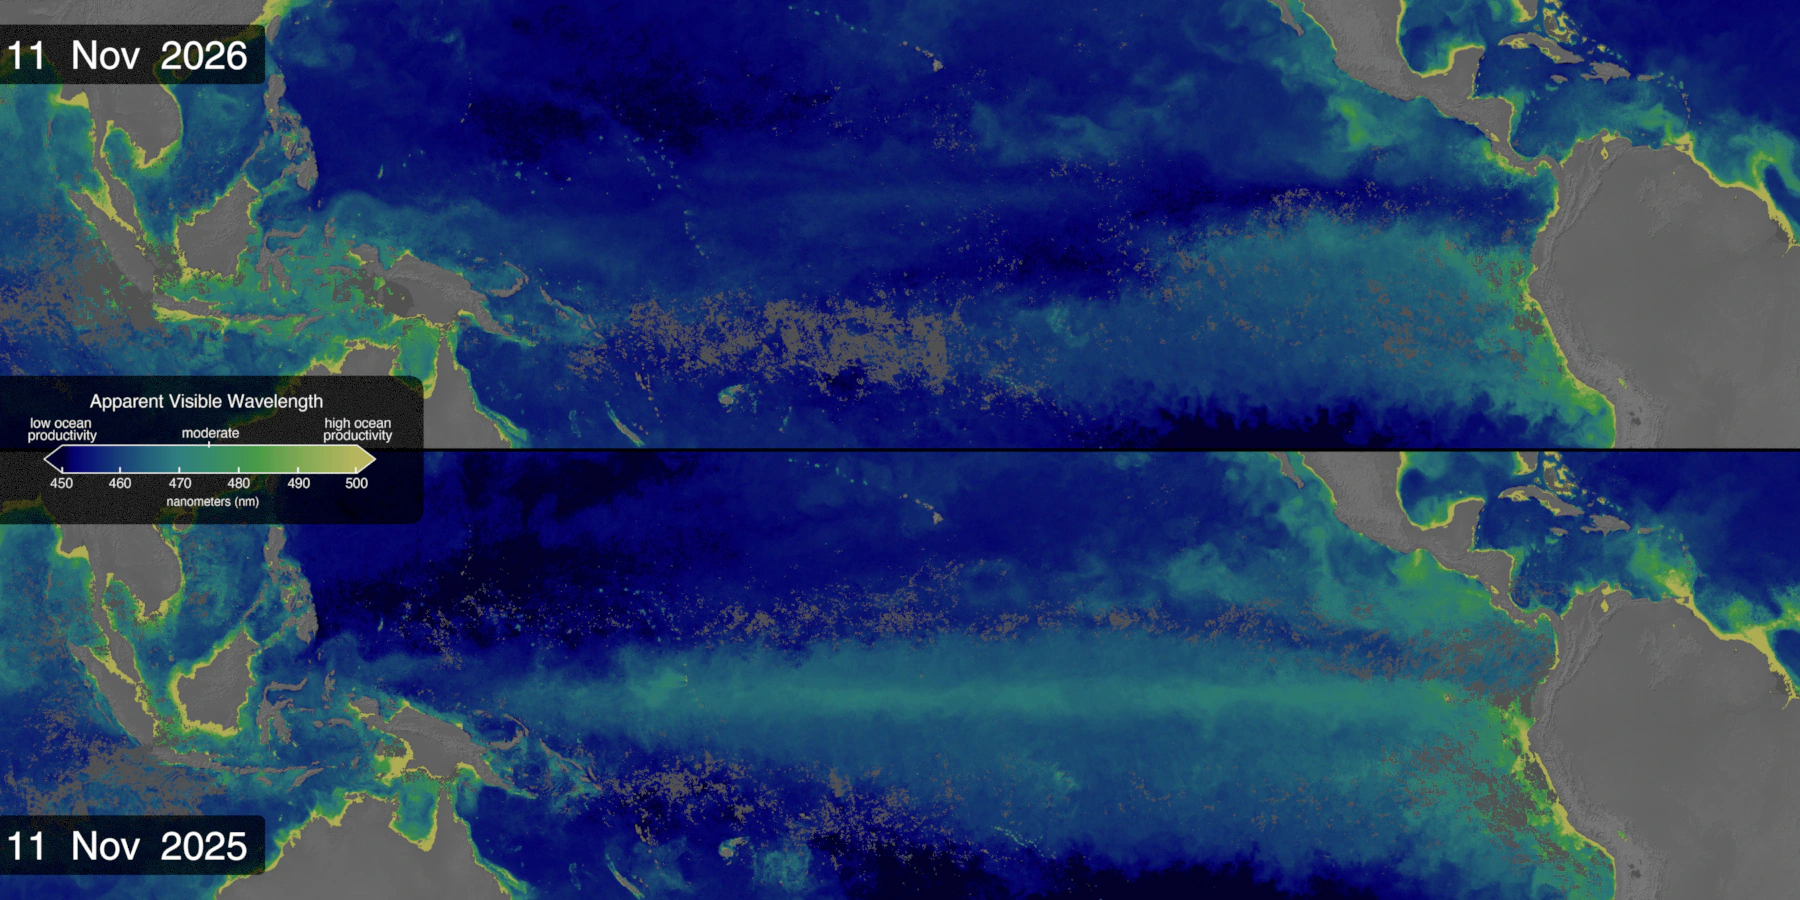
- NASA’s comparison of the same periods in 2025 and 2026 shows a narrower green band in parts of the equatorial Pacific in 2026.
On November 10, NASA’s Scientific Visualization Studio released a global ocean color map based on observations from the PACE satellite. Shades from deep blue to green and yellow-green offer clues to where phytoplankton are found in surface waters. The map updates daily as new data become available, and each frame shows a rolling 30-day average. Consecutive frames share most of their observations, making persistent changes in the color bands easier to see in the animation.
How a spectrum becomes a map
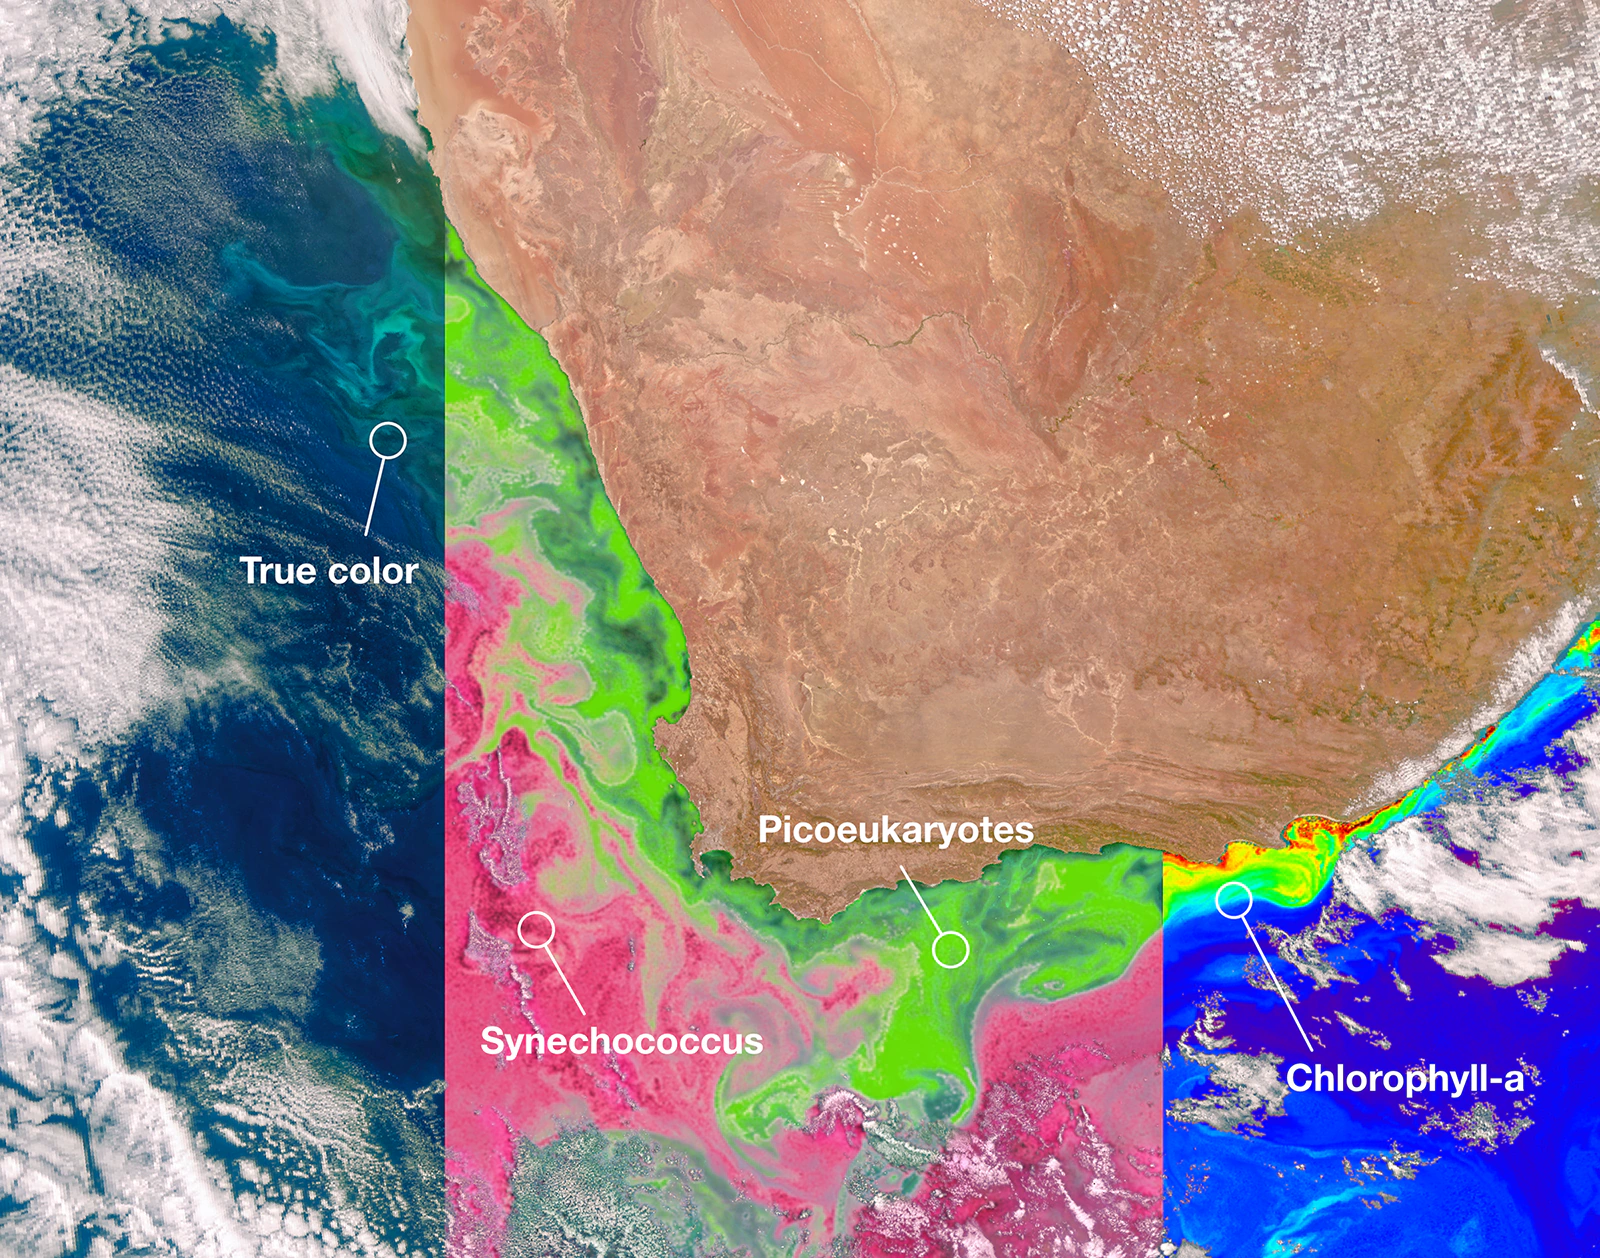
Phytoplankton use sunlight for photosynthesis and form the base of the marine food web. Their pigments absorb some wavelengths of light and change the spectrum of light coming back out of the water. PACE’s Ocean Color Instrument (OCI) measures light across many bands. The team summarizes the spectrum of remote-sensing reflectance from 400 to 700 nanometers in one number called apparent visible wavelength (AVW).
NASA’s scale runs from blue at about 450 nanometers to yellow-green at about 500. Bluer waters generally contain less phytoplankton, while greener or yellower waters often contain more. Coastal sediment and colored dissolved organic matter also influence ocean color. For estimates of chlorophyll a concentration, open the PACE chlorophyll a layer in NASA Worldview. Its scale is in milligrams per cubic meter (mg/m³).
Why the equatorial Pacific turned bluer
NASA compared ocean color in the equatorial Pacific over the same periods in 2025 and 2026. In parts of the ocean, a previously greener band narrowed in 2026, suggesting there may have been less phytoplankton. That fits the pattern expected during El Niño. Weaker trade winds reduce the upwelling of nutrient-rich water from depth, leaving phytoplankton with fewer nutrients at the surface.
Follow the changes on the map
Open NASA’s original release below for the latest Pacific-centered view. It lets you follow the whole band of color along the equator. Check the date and the wavelength scale in nanometers, then play the animation to see the band expand and contract over several weeks. Light gray in high-latitude waters marks sea ice.