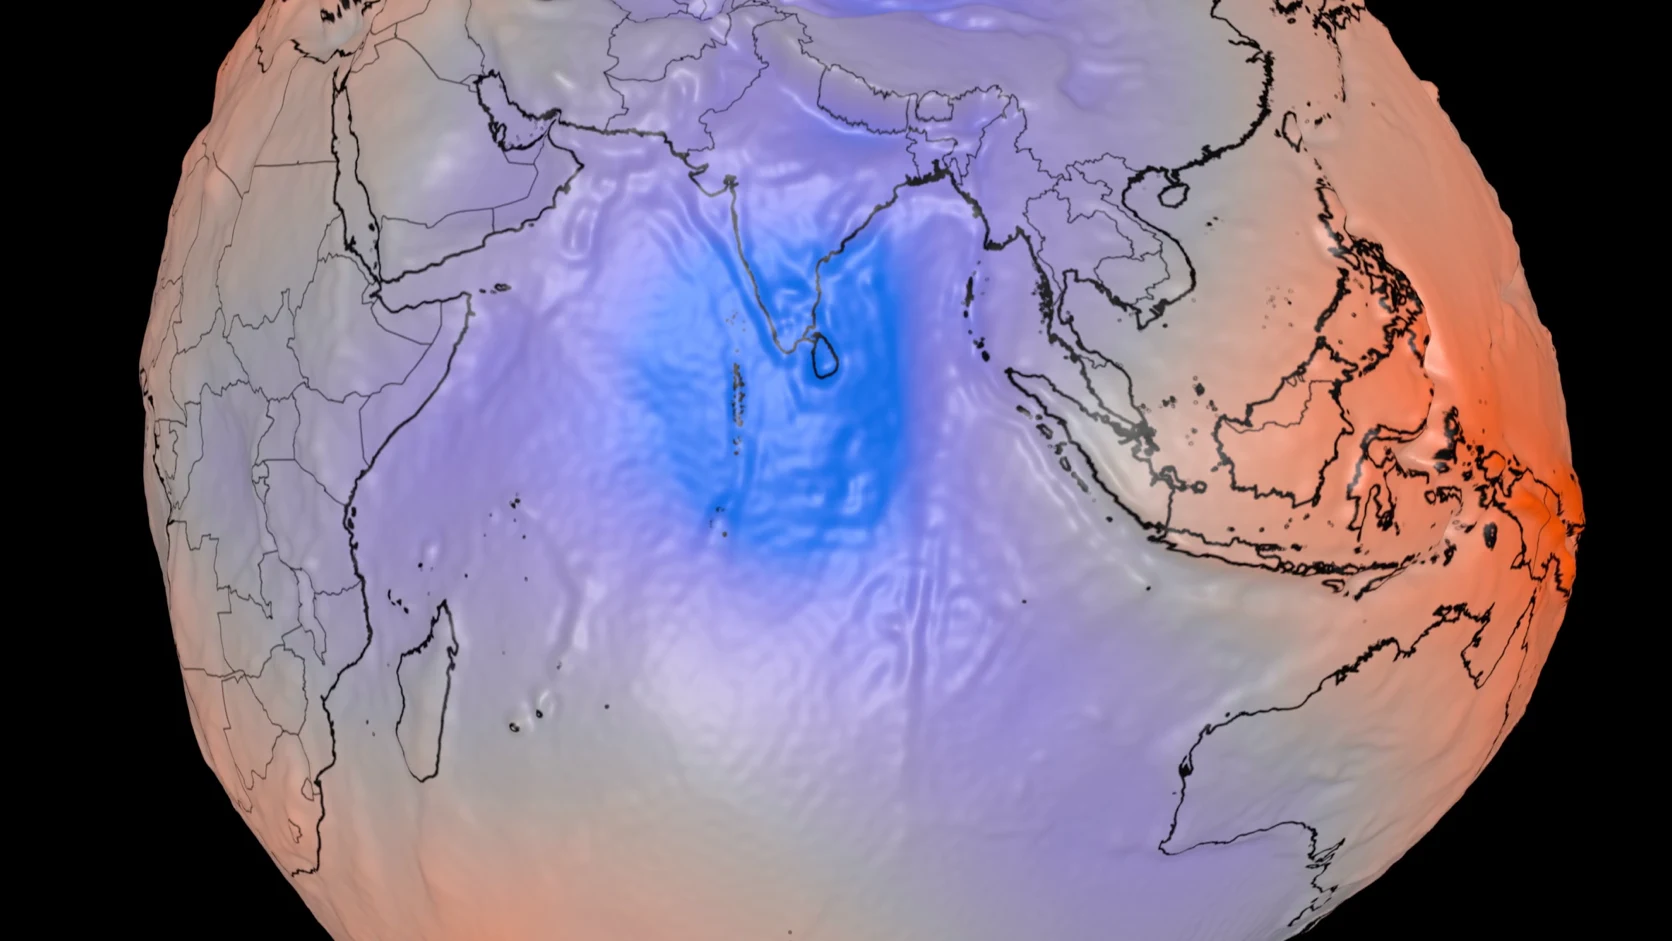
NASA’s Scientific Visualization Studio released a geoid visualization in July 2026 using the GOCO06s global gravity-field model. Heights ranging from about +85 metres near Iceland to −106 metres south of India were exaggerated 10,000 times, producing the potato-like appearance. The image maps a gravity equipotential surface; it is not Earth’s physical shape or a terrain map.
Key points
- NASA released a scientific visualization of the gravity field; its outline does not represent Earth’s physical surface or terrain.
- The geoid is the gravity equipotential surface that best matches global mean sea level. It can be imagined as a motionless ocean shaped only by gravity and rotation, without tides, waves or currents, and extended through the continents.
- In NASA’s visualization, geoid heights range from about +85 metres near Iceland to −106 metres south of India, a total difference of roughly 191 metres.
- The visualization exaggerates these height variations 10,000 times. At true scale, the bumps would be almost invisible.
- The underlying GOCO06s model combines more than 1.16 billion observations from 19 satellites over 15 years, including NASA’s GRACE and ESA’s GOCE.
The colourful “potato Earth” circulating on social media originated with NASA’s Scientific Visualization Studio. On 15 July 2026, the studio at NASA’s Goddard Space Flight Center released The Geoid, turning a global gravity-field model into a rotatable three-dimensional geoid. The relief shows changes in a gravity equipotential surface, not mountains, trenches or the crust assembled at true scale.
What does the image actually show?
The geoid is an equipotential surface in Earth’s gravity field. Imagine the oceans covering the entire planet, with tides, waves, wind and currents removed: the surface on which the water would rest under gravity and rotation is the geoid. It extends through the continents and provides the physical reference closest to global mean sea level for height systems. Along the same equipotential surface, there is ideally no difference in potential that would make water flow in one direction.
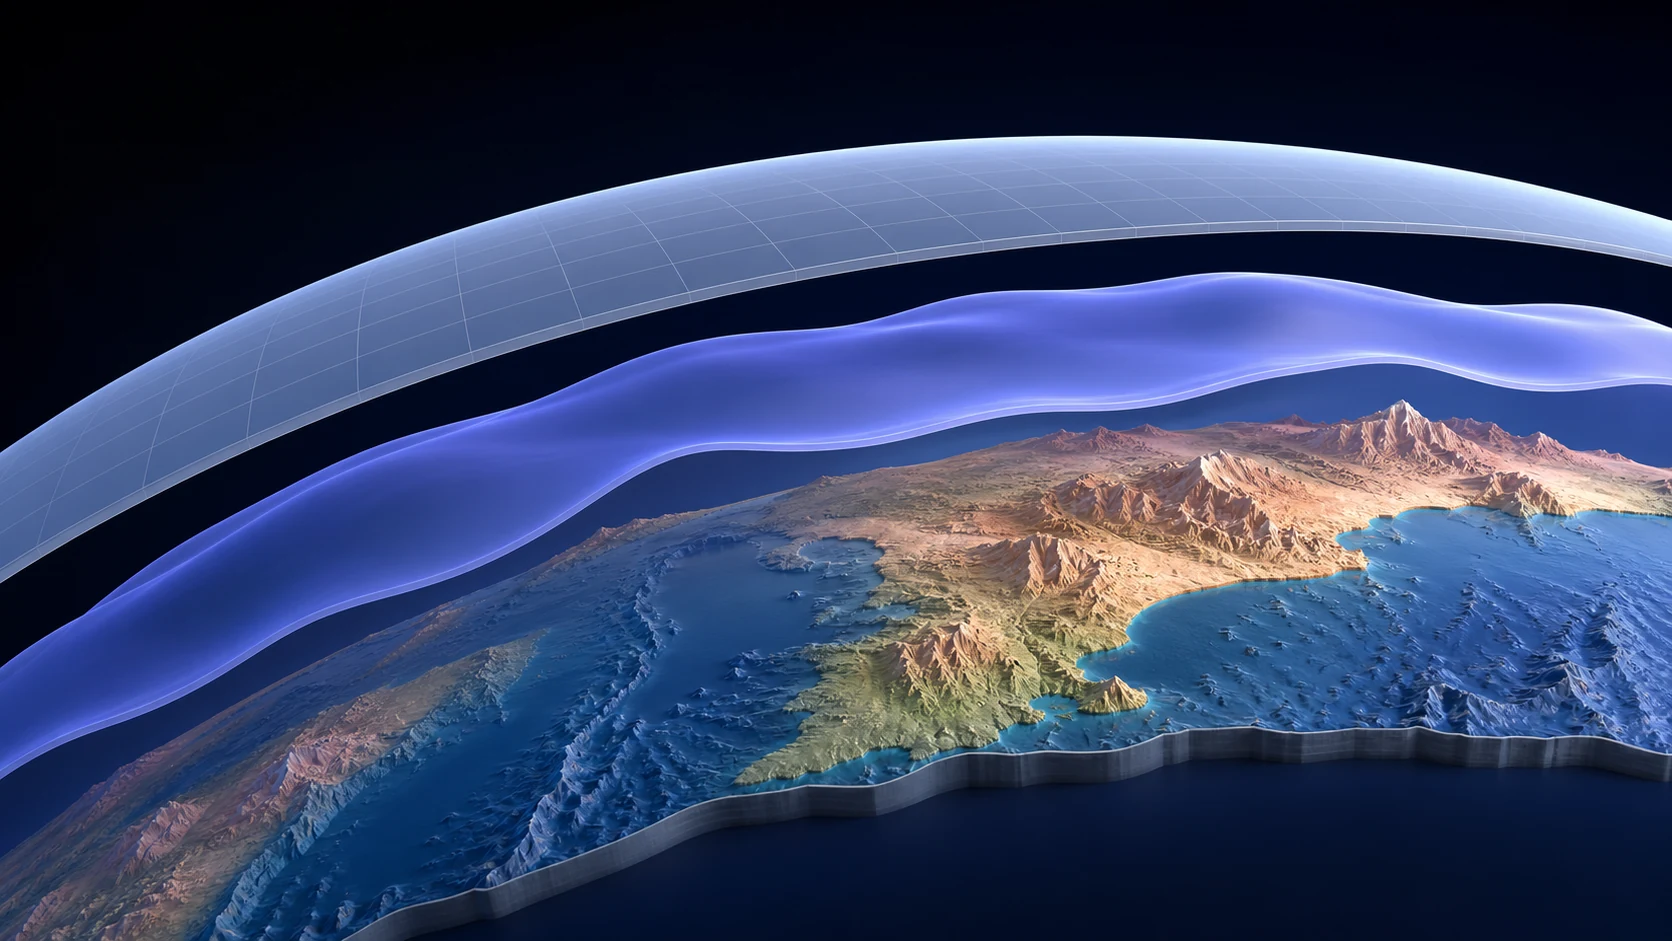
Three different ideas about Earth’s “shape” are often confused. A reference ellipsoid is a smooth mathematical model used for coordinates; the topographic surface contains mountains, plains and the seafloor; the geoid is determined by gravitational potential. Uneven mass inside and on Earth, together with rotation, makes gravity vary from place to place, so this ideal still-ocean surface undulates slowly relative to the reference ellipsoid.
The highest and lowest points differ by only about 191 metres
NASA gives the GOCO06s geoid-height range as about +85 metres near Iceland to −106 metres south of India. The signs indicate whether the geoid lies above or below the reference ellipsoid; they are not local elevations. The total difference is about 191 metres, only around 0.003% of Earth’s mean radius of 6,371 kilometres. Drawn at true scale around the whole planet, the outline would remain extremely smooth.
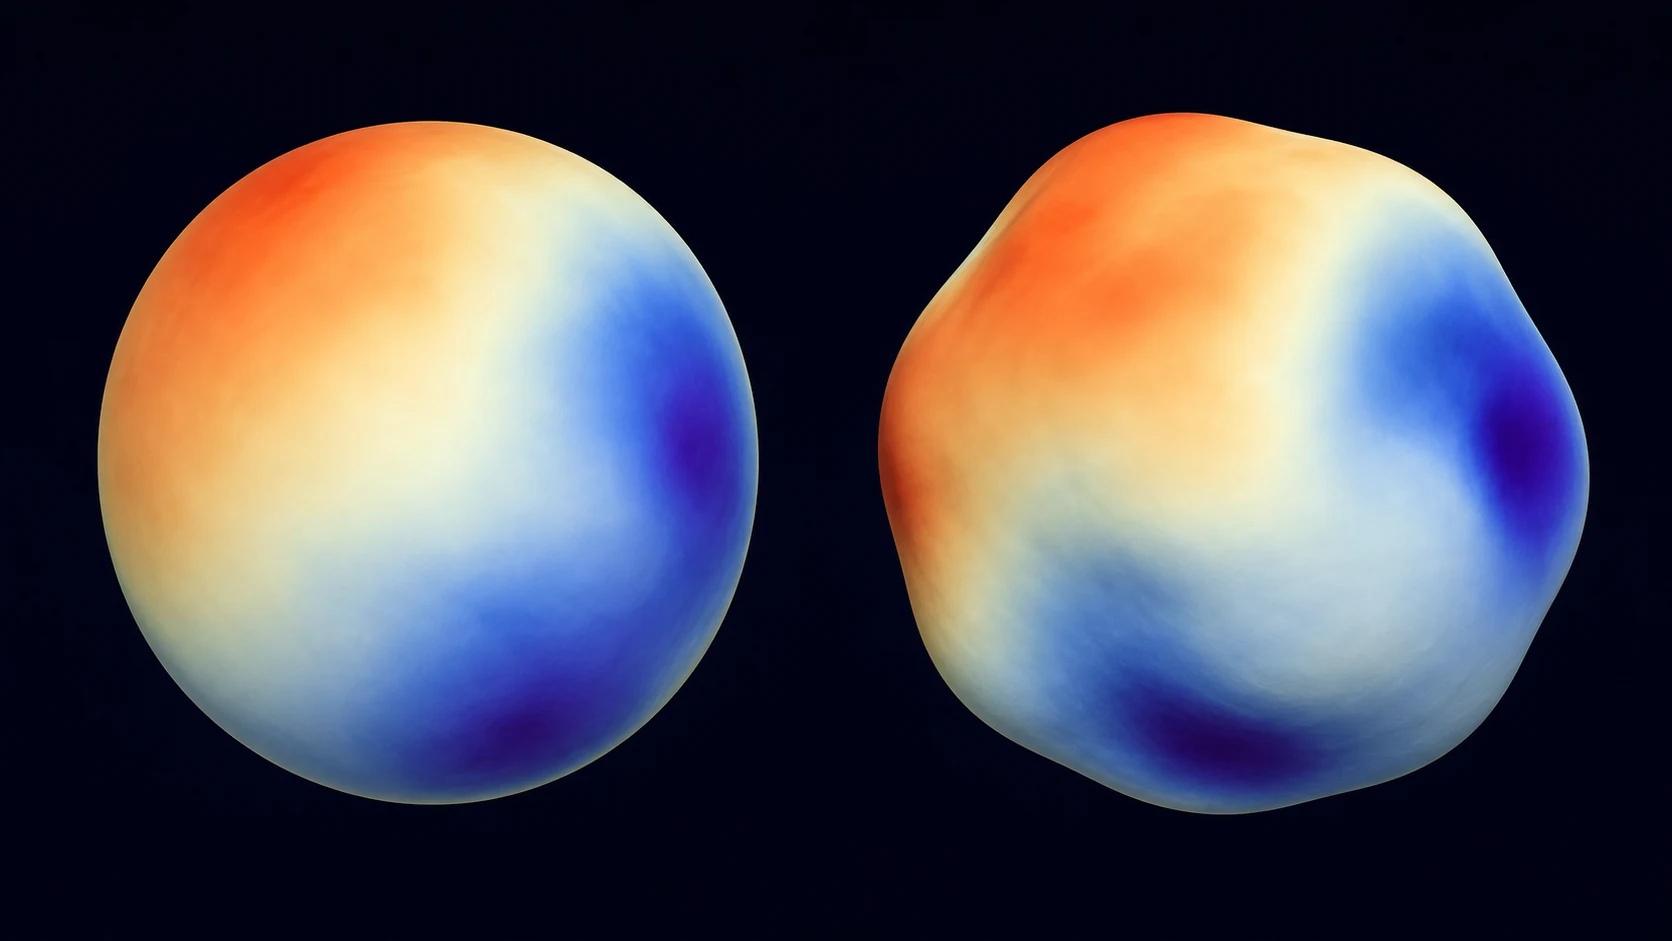
To make the difference visible, NASA exaggerated the radial variation by a factor of 10,000. In purely geometric terms, the original 191-metre span appears as roughly 1,910 kilometres in the visualization, creating the dramatic bumps. Colour also encodes geoid height; it does not show rock composition, temperature or the direction of gravity.
How close is Earth itself to a sphere?
Earth’s rotation makes the equator bulge and the poles slightly flatten. NASA Goddard lists an equatorial radius of about 6,378 kilometres and a polar radius of about 6,357 kilometres, a difference of roughly 21 kilometres. This oblate shape and the geoid’s hundred-metre-scale variations relative to an ellipsoid are features at two different scales. From space, Earth’s outline looks nearly circular, but scientific models still account for these small differences.
How does GOCO06s assemble the global gravity field?
The visualization uses values from GOCO06s. The GOCO team combined more than 1.16 billion observations collected by 19 satellites over 15 years into a global gravity-field model, expanded to spherical-harmonic degree 300. The inputs include GRACE measurements of changing distance between twin satellites, GOCE gravity-gradient data, satellite laser ranging and precise orbits from several low-Earth-orbit satellites. Each technique is most sensitive at different spatial scales, so the combined solution balances their weaknesses.
NASA’s image is therefore a model result produced after calibration, background modelling, orbit analysis, statistical weighting and spherical-harmonic expansion. Its shape is calculated and visualized from data; it should not be treated as a moment recorded directly by a camera. GOCO06s also includes long-term trends and annual variation terms. Like any model, it has finite spatial resolution, measurement errors and processing assumptions, so no small bump should be attributed to a particular mountain or a single underground structure.
What is the geoid used for?
Satellite positioning normally provides geometric height relative to a reference ellipsoid, while engineering, surveying and mapping often need orthometric height close to what we call elevation above sea level. A geoid model converts between them. It is also essential for studying sea-surface height differences, global ocean circulation, sea-level change and ice-sheet mass, because the gravity-equivalent surface must be removed before dynamic height caused by wind, temperature, salinity and currents can be isolated.
The most important lesson is not that “Earth is really shaped like a potato”, but that its gravity field has small, measurable regional differences. NASA’s 10,000-fold vertical exaggeration turns subtle values into a readable shape. Once the physical surface, terrain, reference ellipsoid and geoid are kept separate, the image is no longer mysterious.