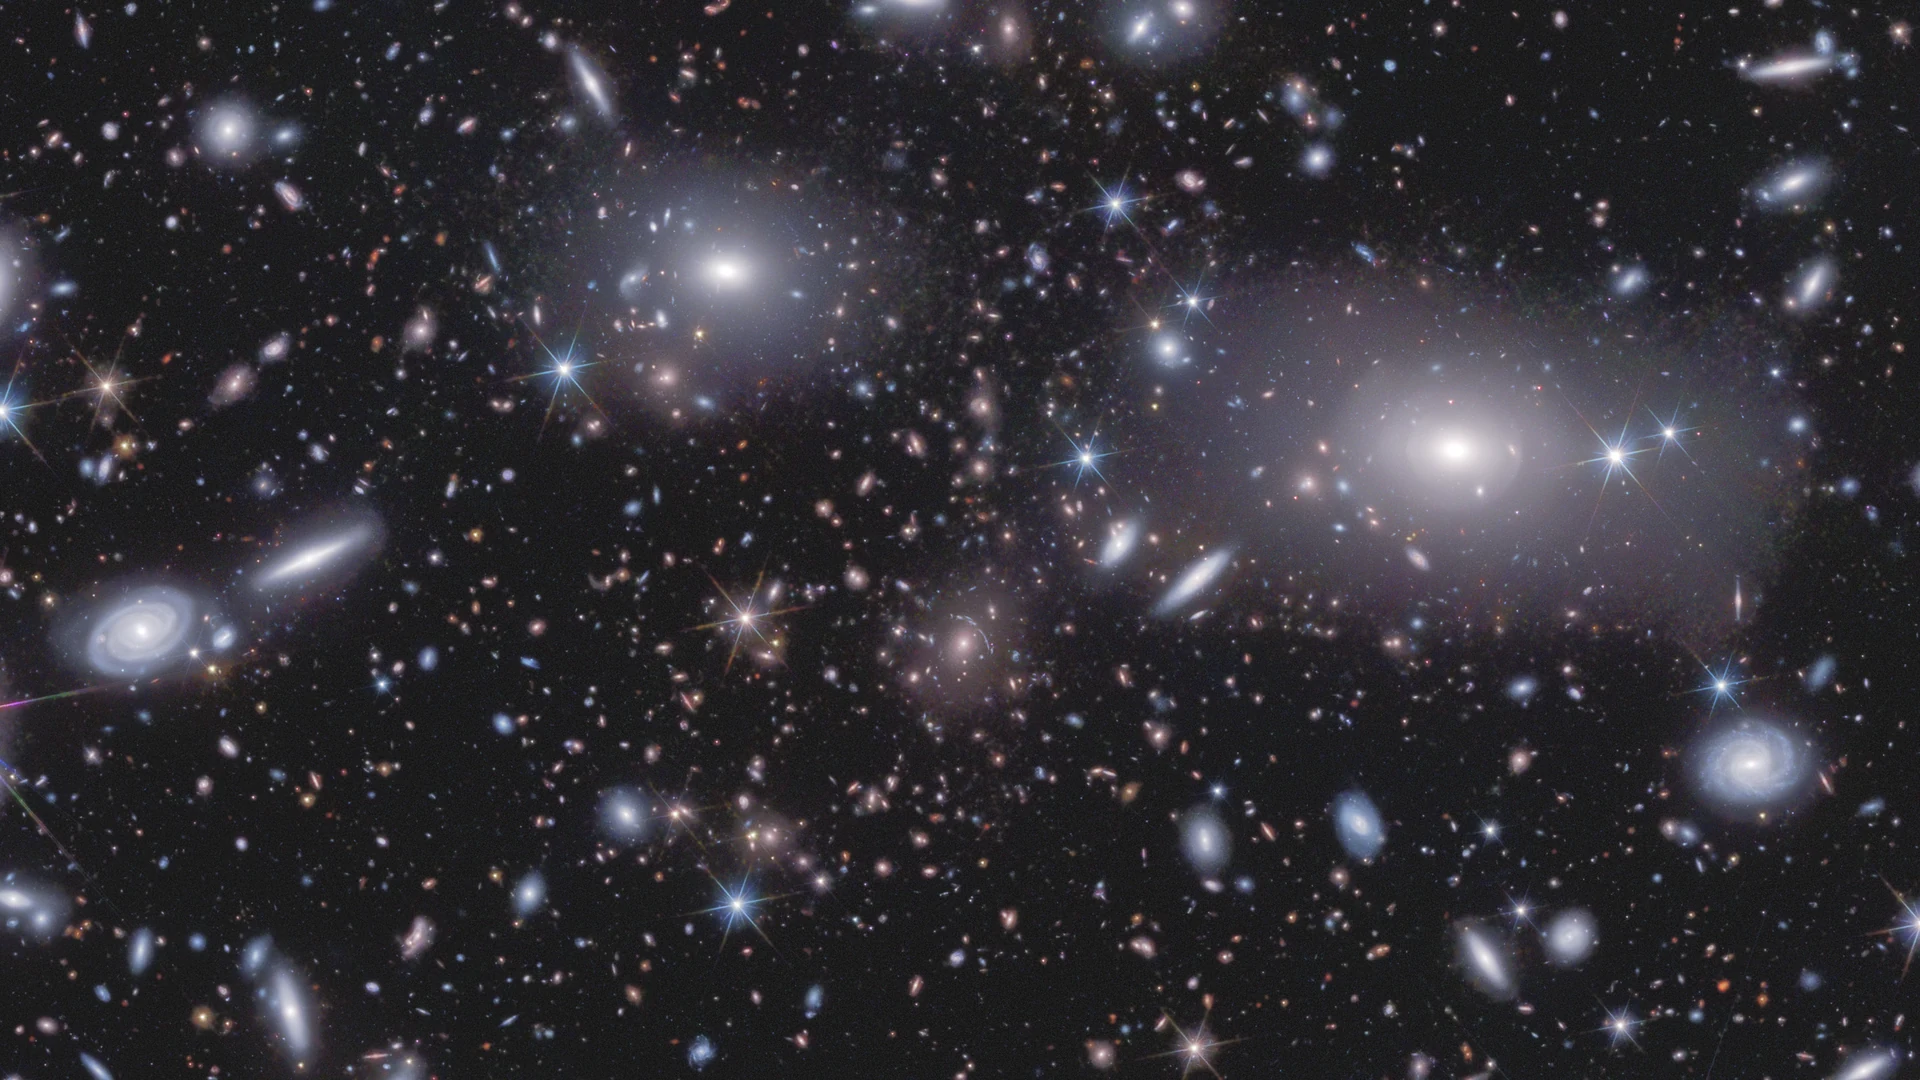
Euclid’s DR1-Foundation covers about 1,900 square degrees. Astronomers can use spectra to measure redshifts and map the cosmic web in 3D.
Key points
- DR1-Foundation draws on about 13 months of observations. Its wide survey covers roughly 1,900 square degrees, about 14% of the area planned for the six-year mission.
- The release catalogs over 900 million galaxies and provides spectra for more than 160 million sources. Reliable spectroscopic redshifts can be used to estimate galaxy distances.
- The strong-lens catalog lists 15,072 high-confidence candidates. The full DR1 release is expected in June 2027 with weak-lensing measurements and 3D galaxy catalogs.
The Euclid space telescope has cataloged more than 900 million galaxies, providing the observations needed to build a three-dimensional map of the universe. The European Space Agency (ESA) and the Euclid Consortium released DR1-Foundation, the mission’s first major survey dataset, on November 12, 2026. It brings together about 13 months of observations and records light from over a billion celestial objects.
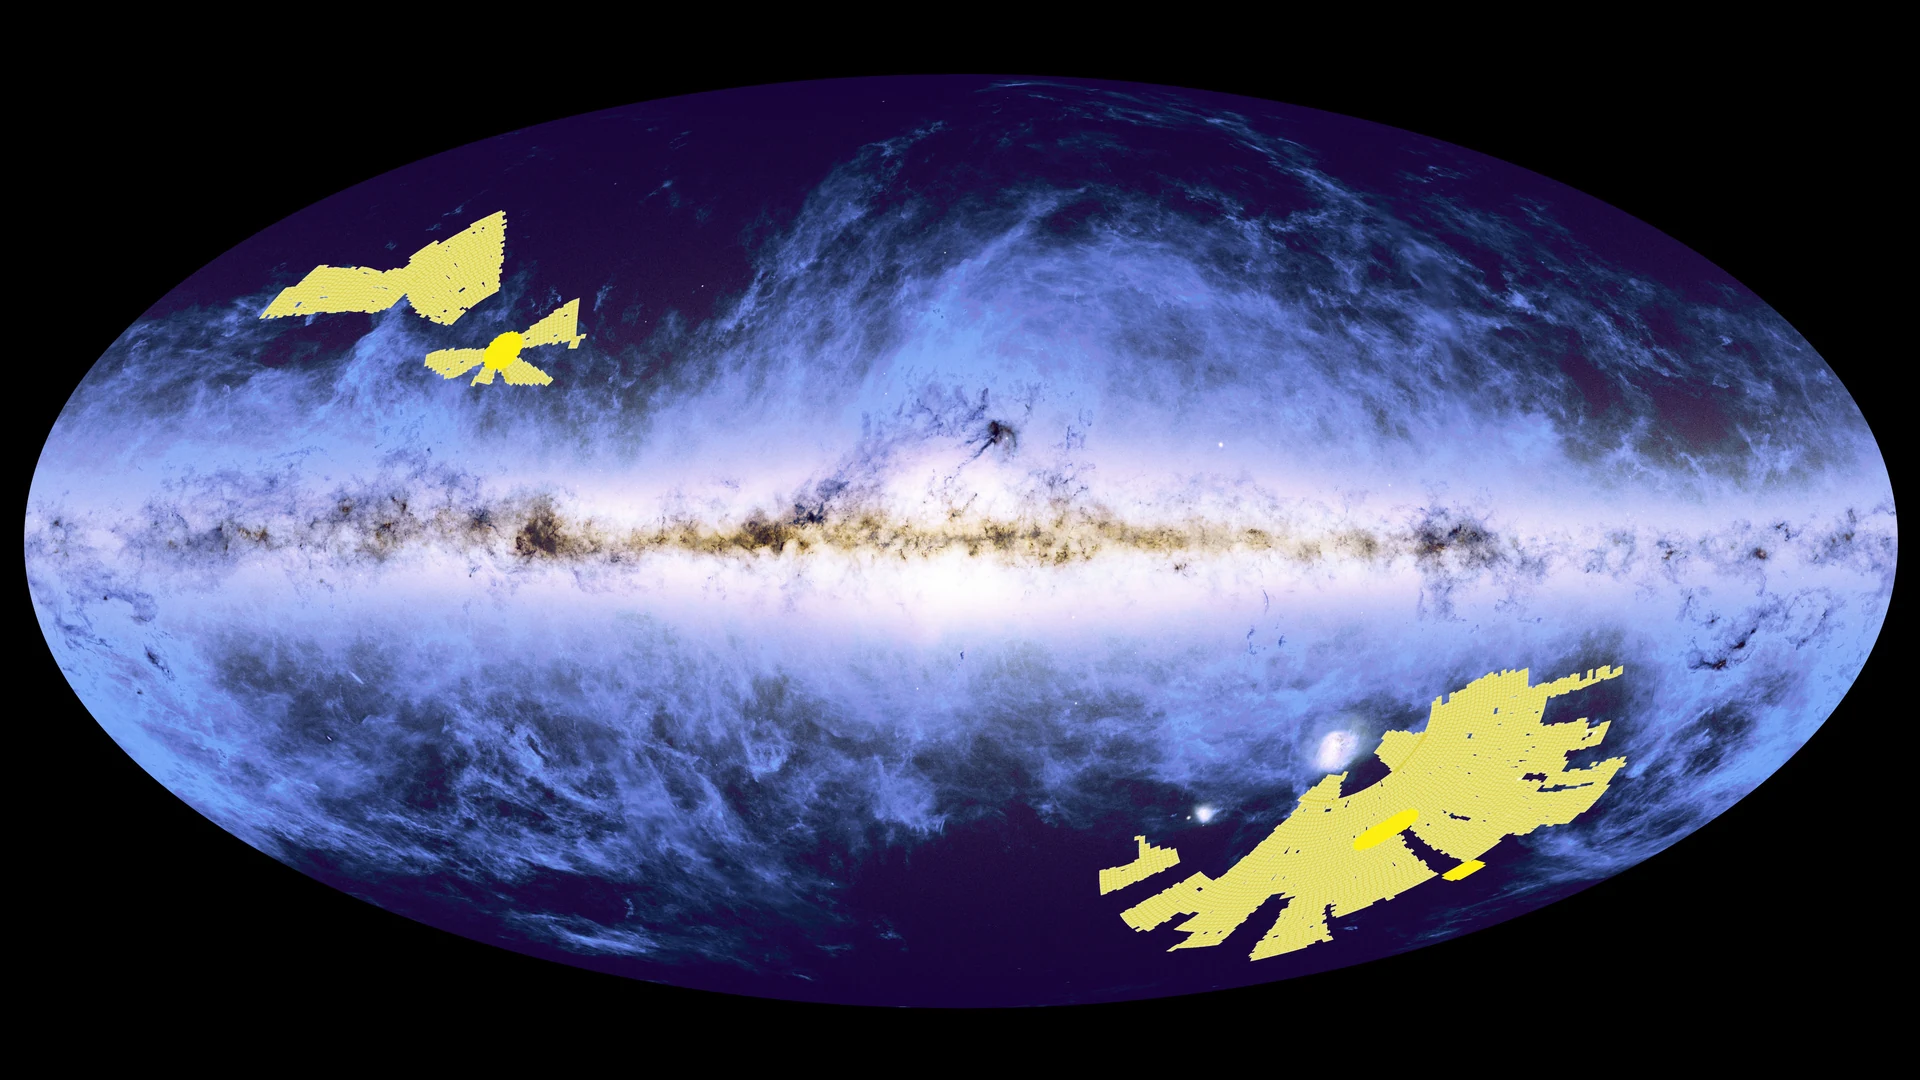
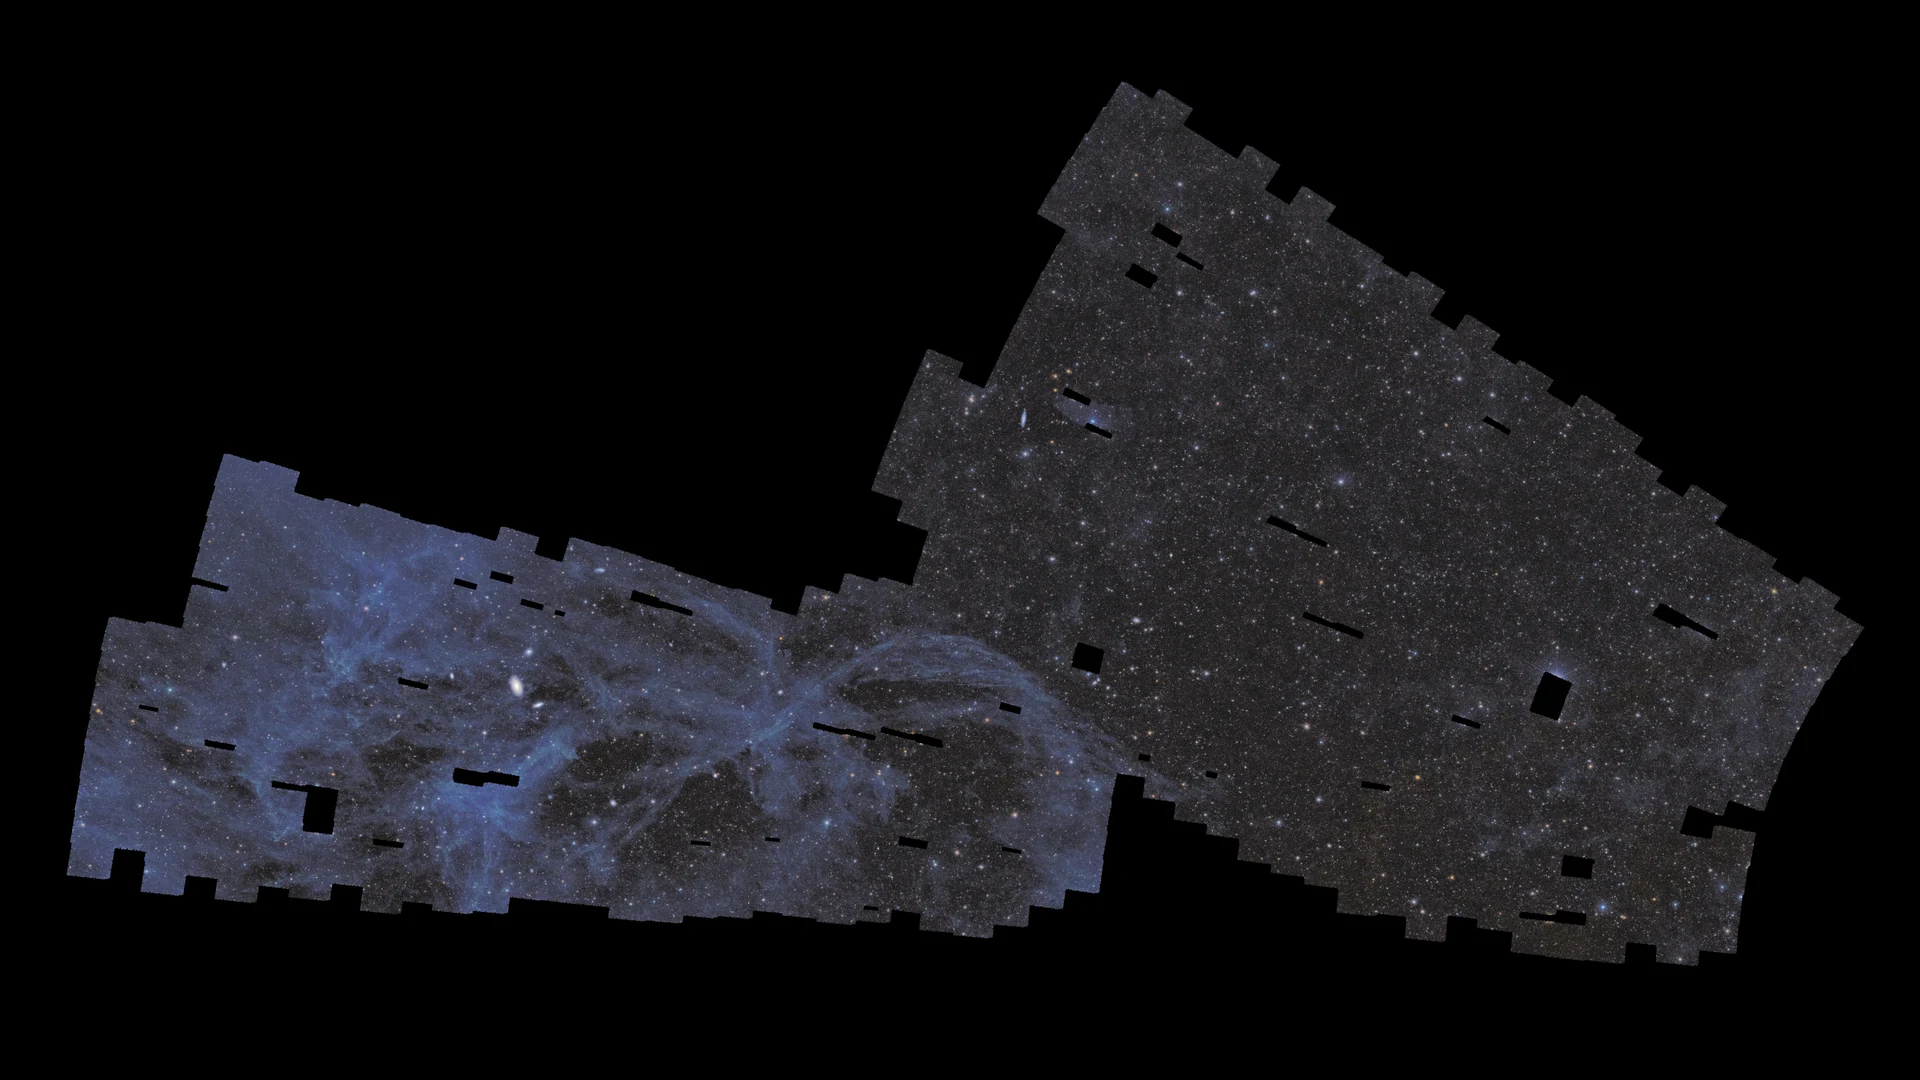
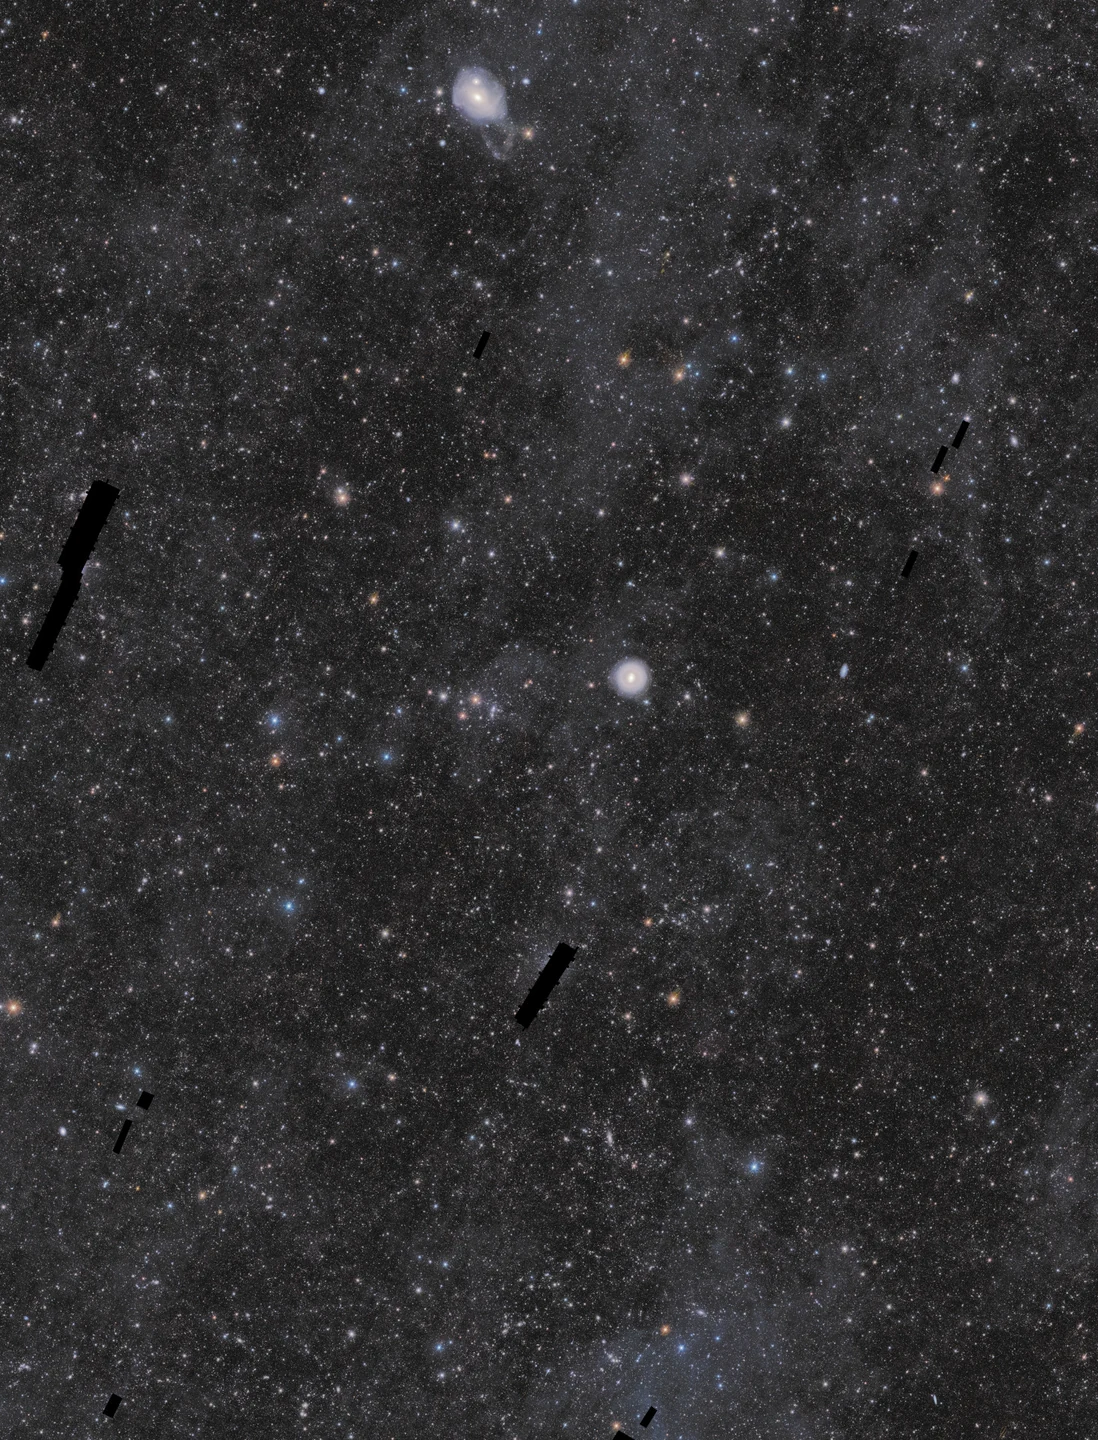
The wide survey data cover about 1,900 square degrees, equivalent to the apparent area of about 9,500 full moons and roughly 14% of the six-year mission’s target area. One northern mosaic alone combines 740 observations across 367 square degrees and contains nearly 500 billion pixels. The VIS camera captures galaxy shapes in visible light, while the NISP instrument records near-infrared images and spectra.
Reading galaxy distances from spectra
An image gives a galaxy’s direction on the sky. A spectrum offers clues to its distance. NISP uses slitless spectroscopy to separate light by wavelength for many objects in the same field. Astronomers identify the hydrogen emission line Hα and compare its observed wavelength with its rest wavelength to measure redshift. As the universe expands, it stretches light to longer wavelengths. Researchers use a cosmological model to turn the redshift into a distance estimate and place the galaxy in three-dimensional space.
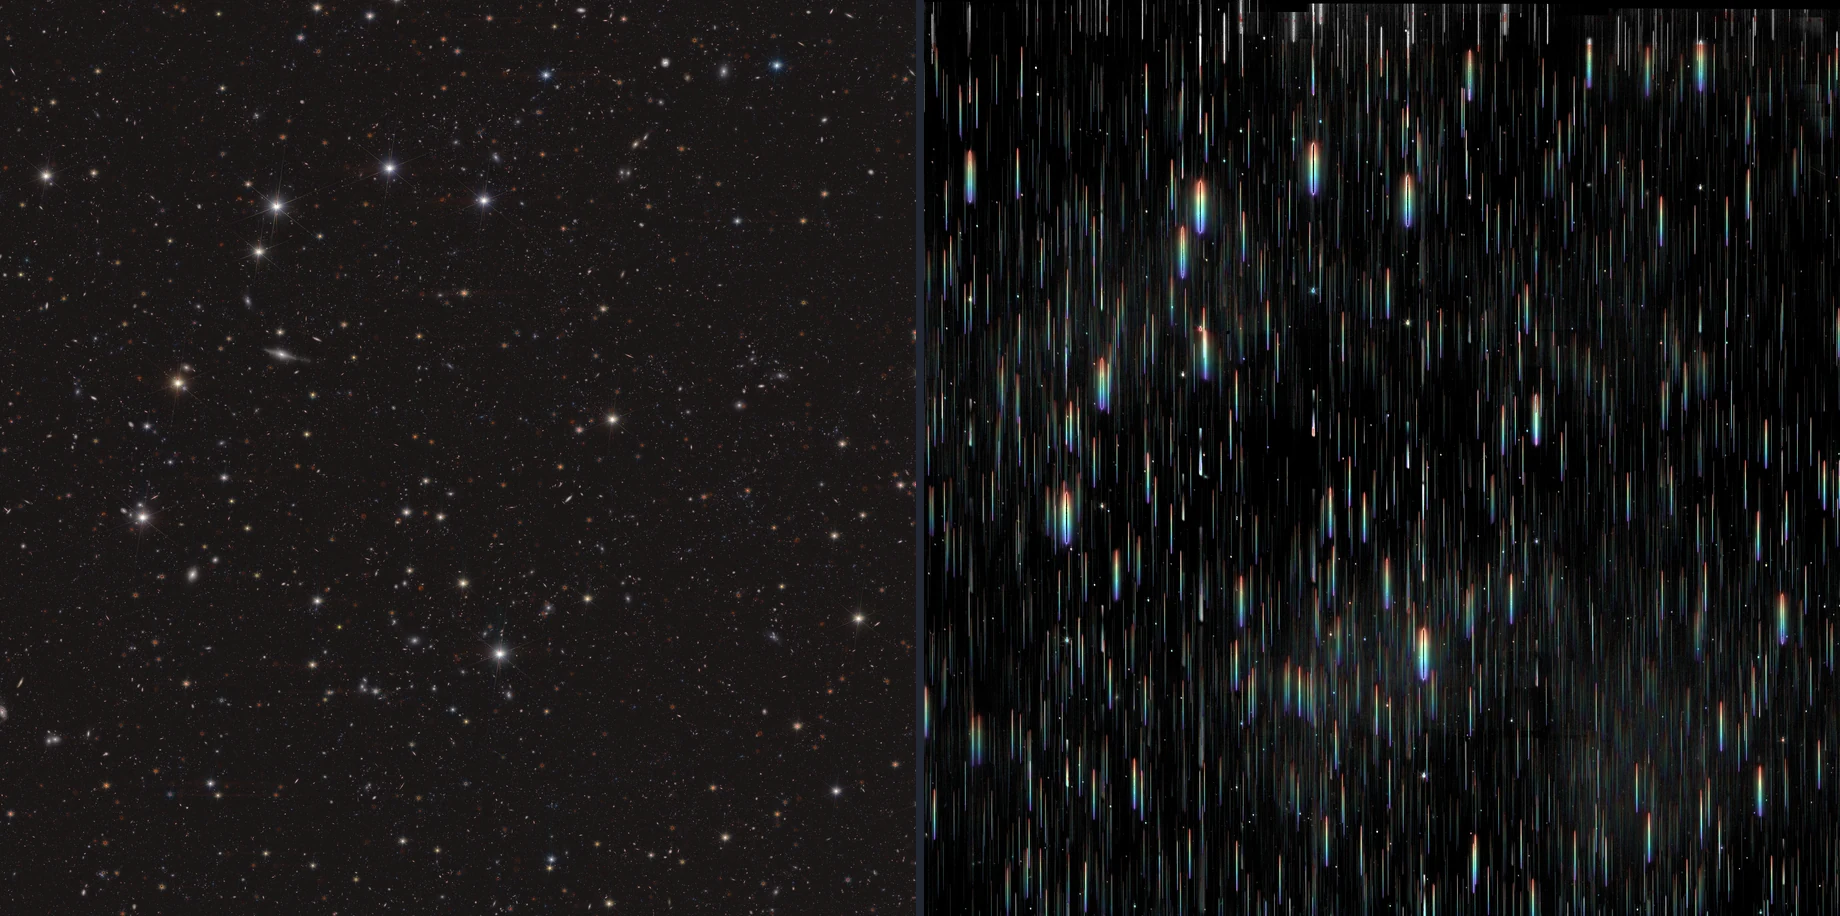
DR1-Foundation provides spectra for over 160 million sources. Some spectral lines are faint, and spectra from nearby objects on the sky can overlap. The team screens redshift measurements for reliability. In three dimensions, the galaxy distribution traces the filaments of the cosmic web, the junctions where galaxy clusters gather, and the voids where galaxies are sparse.
Bent light reveals mass
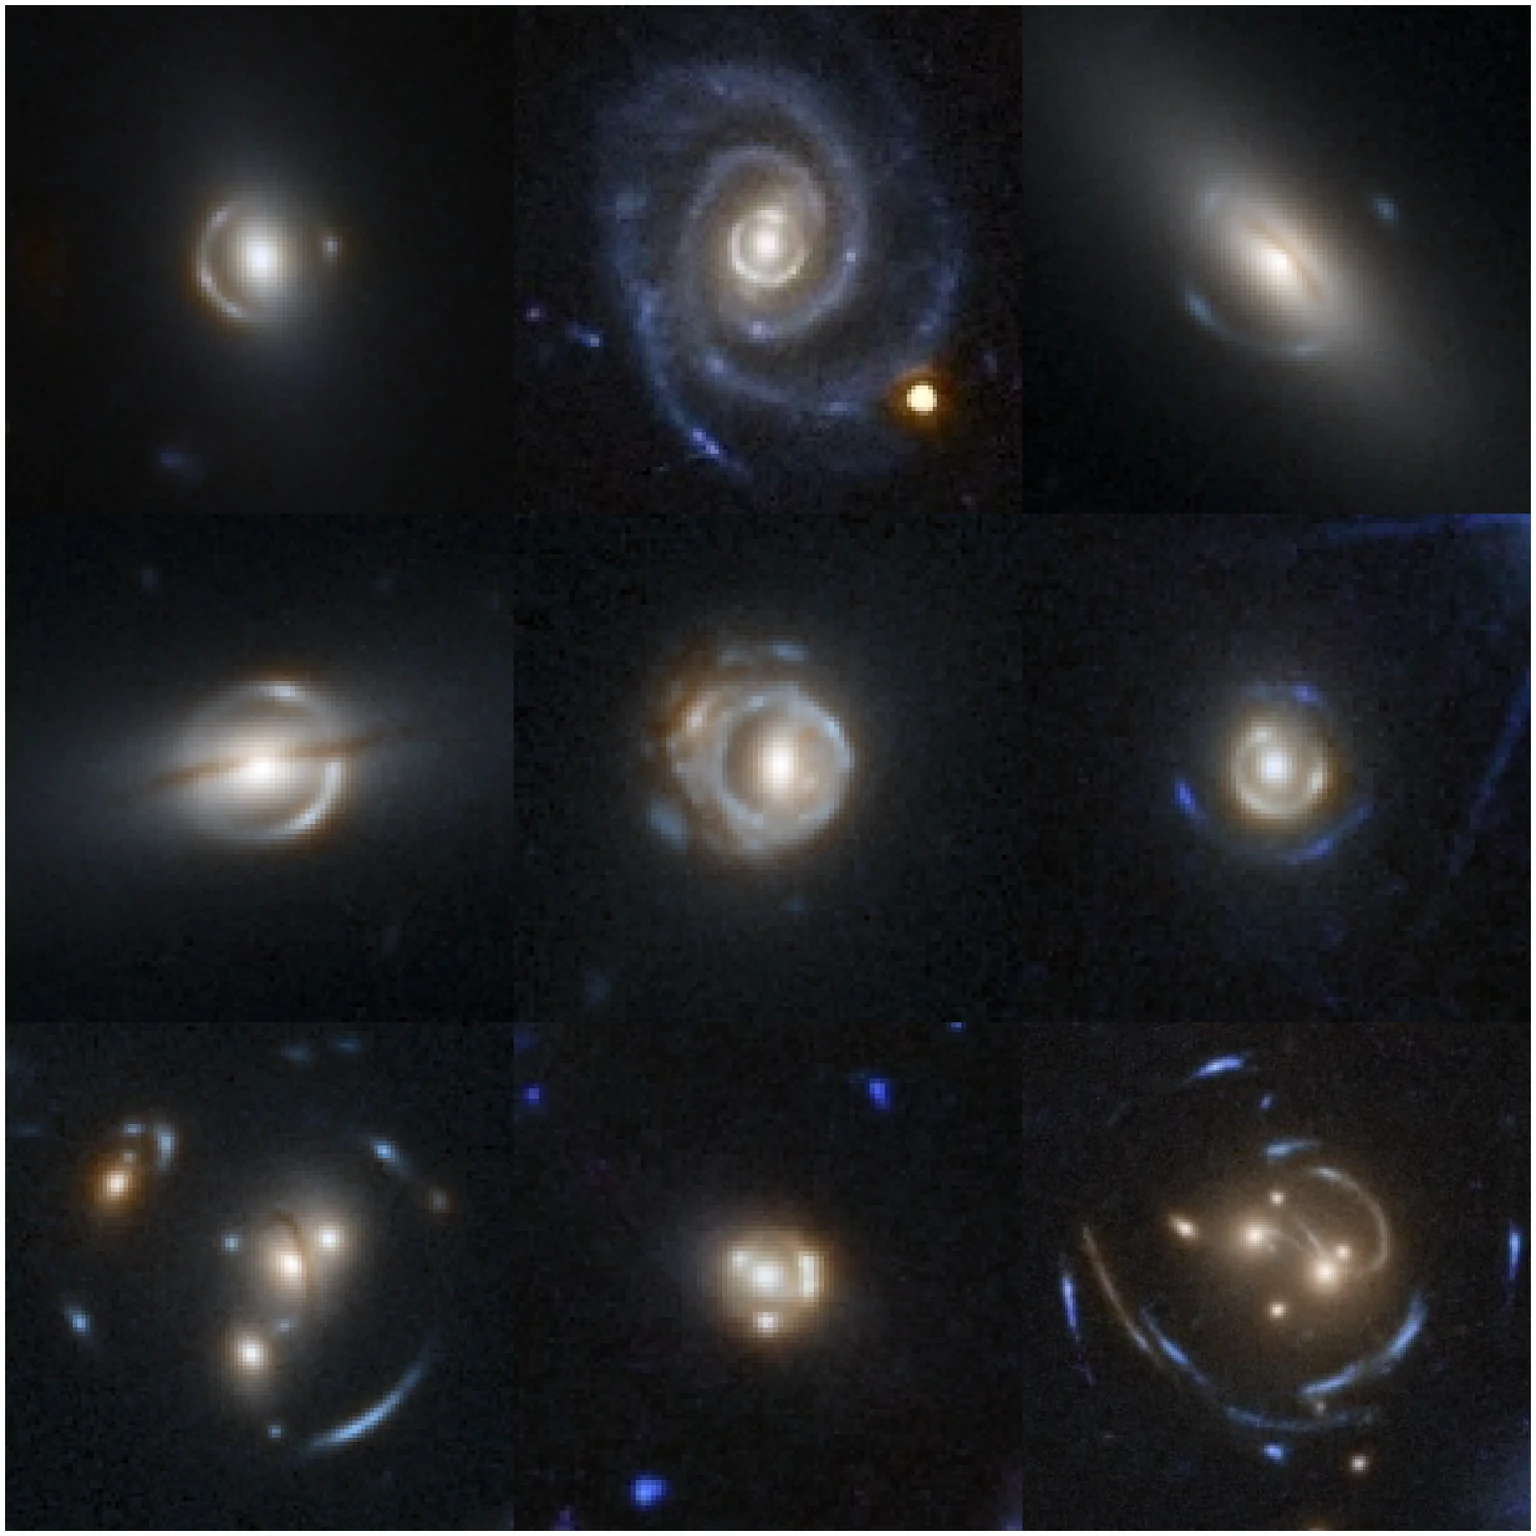
When a foreground galaxy nearly lines up with a more distant galaxy, its gravity can bend the background light into arcs, rings, or multiple images. The team combined machine learning, citizen science, and expert classification to identify 15,072 high-confidence strong gravitational lens candidates. Astronomers can use these images to infer the foreground galaxy’s total mass, including its dark matter.
ESA currently schedules the full DR1 release for June 16, 2027. It is expected to add three-dimensional galaxy catalogs and weak gravitational lensing measurements. Weak lensing subtly distorts the images of many background galaxies. By measuring those distortions statistically and combining them with the 3D galaxy distribution, researchers can trace how matter clumps and study how dark energy affects cosmic expansion and the evolution of large-scale structure.