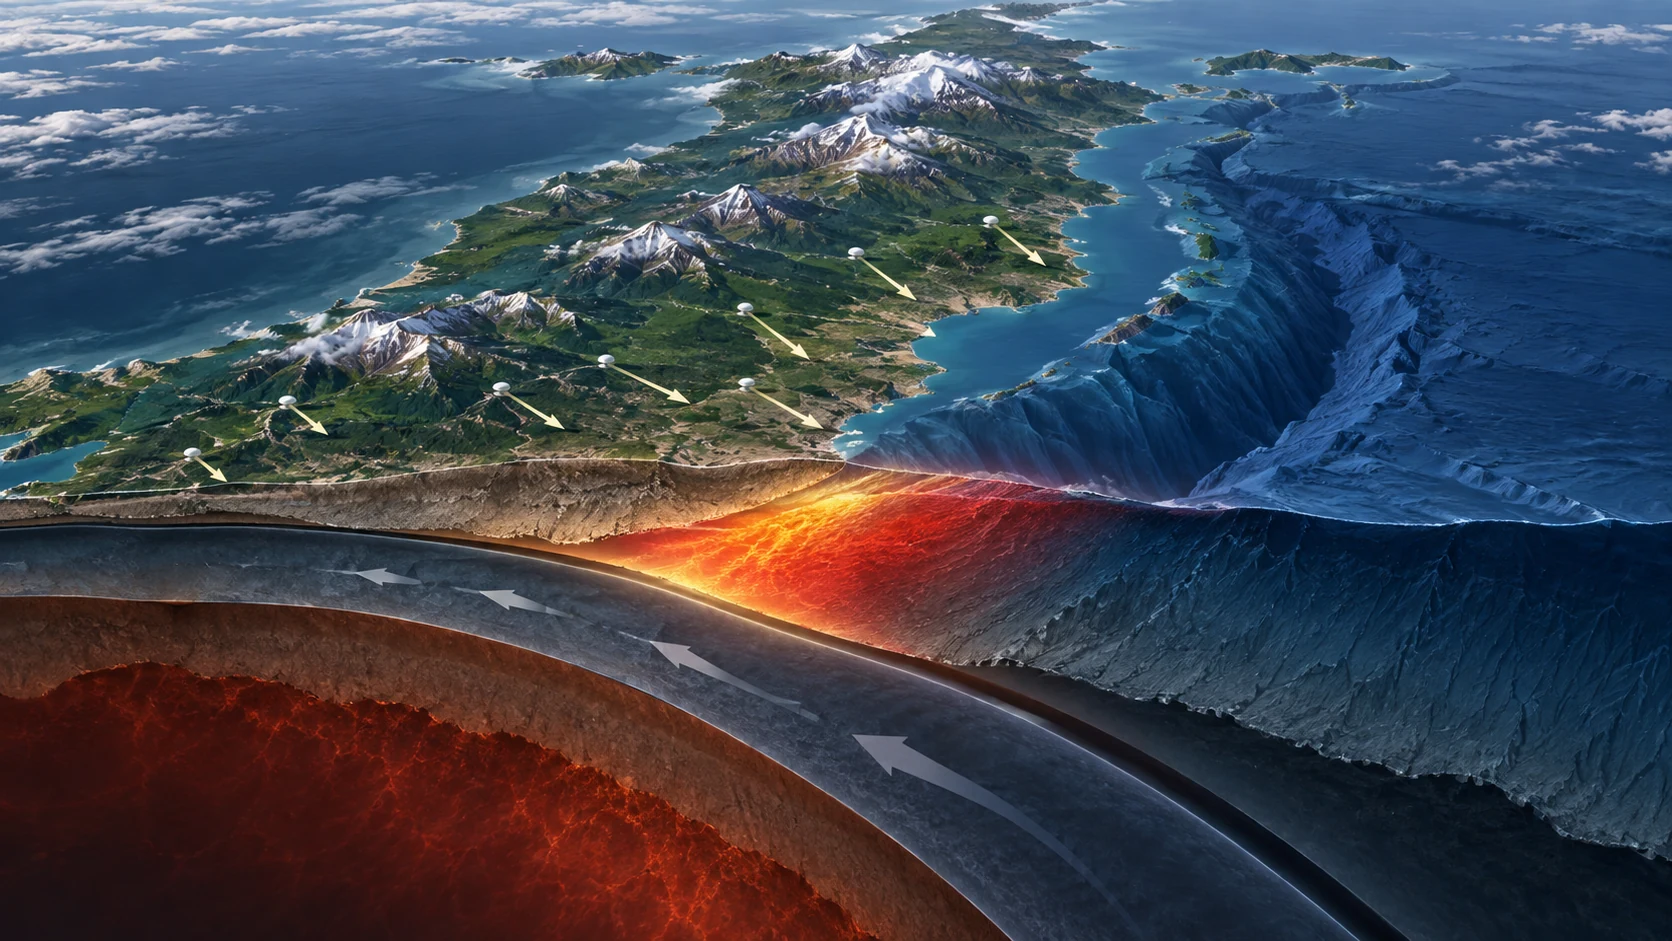
A Geophysical Research Letters study shows that the location of giant earthquakes may not be entirely hidden. By feeding years of Kamchatka GNSS velocity data into a probabilistic model, the team identified locked subduction-zone fault patches that were most likely to rupture; the largest high-locking region matches the main rupture and initiation area of the 2025 Mw 8.8 Kamchatka earthquake. Timing, shallow slip and tsunami size still require additional observations.
Key points
- Axel J. Periollat and Gareth J. Funning published the study on July 15, 2026, using pre-earthquake GNSS ground-motion data to forecast which Kamchatka fault locations were most likely to host a giant rupture.
- The model identifies a main high-locking region whose slip deficit since the 1952 Mw 9.0 earthquake can account for much of the moment released in the 2025 Mw 8.8 event.
- The 1952 and 2025 earthquakes both nucleated within the same long-lived locked region, showing that geodetic data can mark high-risk rupture locations before an event.
- The result supports long-term forecasting of where giant earthquakes may rupture, but it does not forecast exact timing, magnitude, tsunami height or damage.
- The 2025 earthquake had less shallow slip than 1952, helping explain different tsunami impacts and underscoring the need for seafloor geodetic observations.
Earthquake timing remains stubbornly hard to pin down, but where a giant rupture is most likely to start may leave earlier clues. The 2025 Mw 8.8 earthquake off Kamchatka has become a test case for a method that uses pre-event GNSS ground-motion data to forecast likely megathrust rupture locations. In Geophysical Research Letters, UC Riverside geophysicists Axel J. Periollat and Gareth J. Funning report that the model’s pre-event high-locking zone matches the main rupture area that followed.
Here, “forecasting” means location, not a short-term prediction of date, hour or shaking intensity. The method uses geodetic data that were available before the earthquake to identify fault patches more likely to store enough strain for a giant event. In practical terms, it shifts the question from “when exactly will the next earthquake happen?” to “which segment deserves the most attention?”
How GPS Sees a Locked Fault
Kamchatka sits above the boundary where the Pacific plate subducts northwestward beneath the Okhotsk microplate at about 80 millimetres per year. When friction locks parts of the plate interface, the overlying ground slowly deforms over many years. Horizontal velocities recorded by GNSS stations can therefore reveal where strain is building.
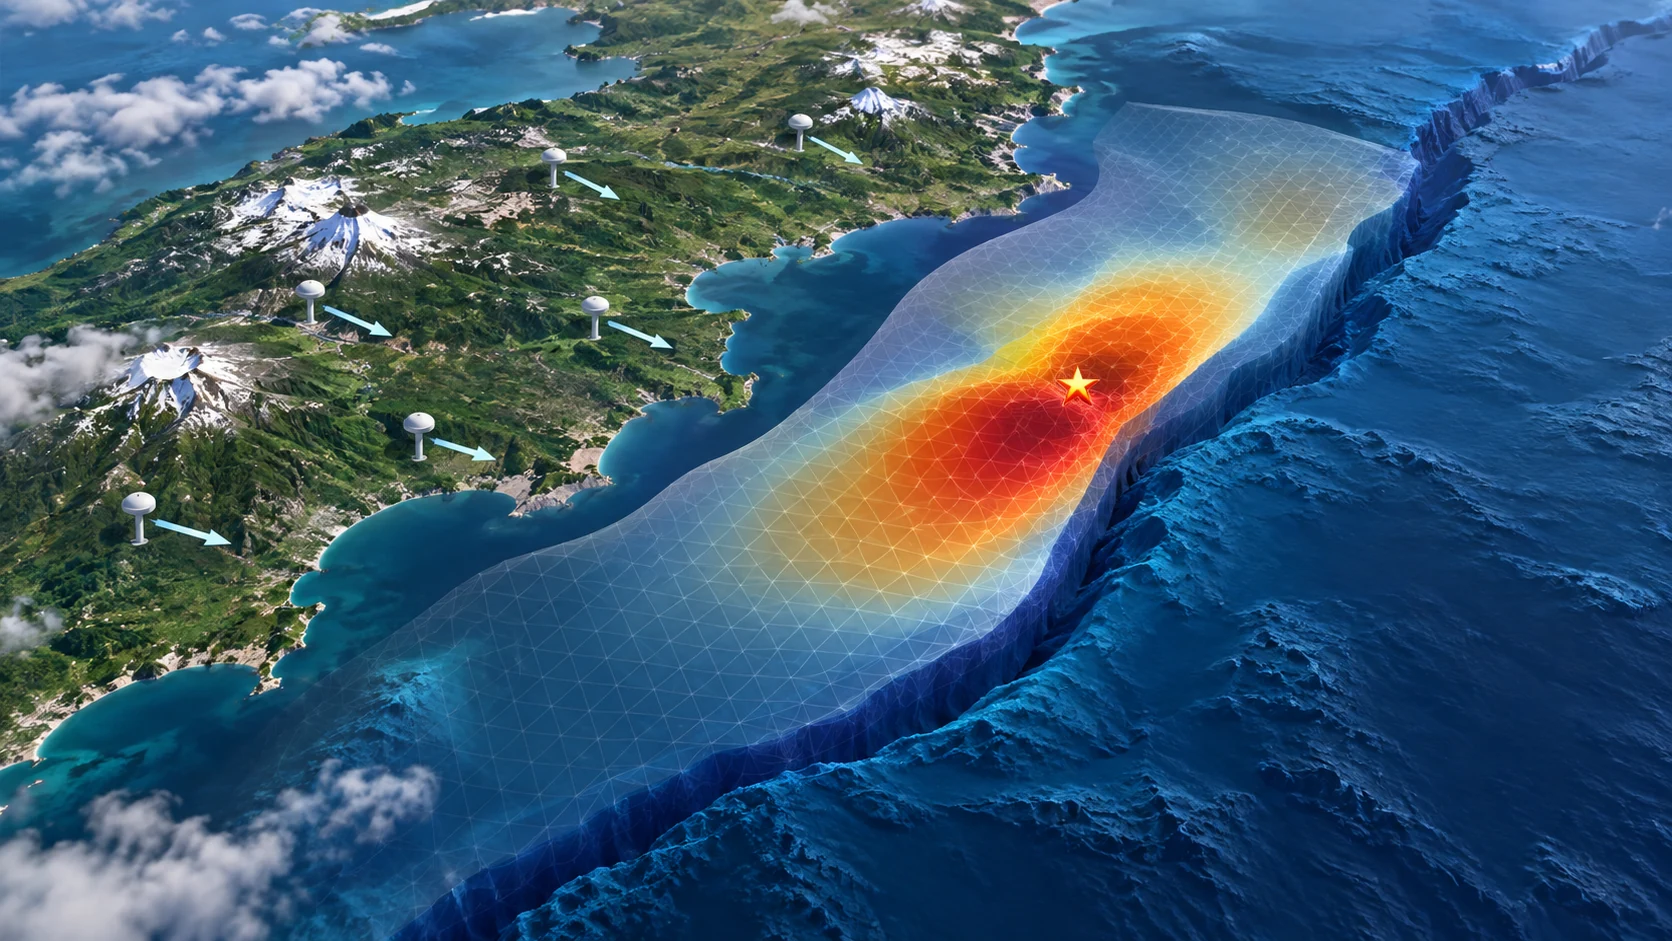
Periollat and Funning used Kamchatka GNSS velocities compiled by Bürgmann and colleagues in 2005, placed them into a boundary-element fault model, and explored possible locking patterns with Metropolis-Hastings sampling. Instead of prescribing where an asperity should be, the model compares many candidate fault configurations with the observed velocities and estimates the probability that each fault element is locked.
The result is a map of future rupture likelihood. Using connected elements with locking probability above 0.45, the paper identifies six high-probability clusters. The largest contains 618 elements, while the sampled median is about 423 locked elements. The hypocentres of both the 1952 and 2025 Kamchatka megathrust earthquakes lie inside this central locked zone, and smaller high-probability patches sit close to the rupture initiation area.
The paper also compares accumulated slip deficit with released seismic moment. The main locked region has built up enough moment deficit since the 1952 earthquake to be comparable to the 2025 Mw 8.8 release, supporting the idea that long-lived locked patches help control where giant ruptures occur. Some details may still reflect station geometry and inversion-edge effects, and offshore shallow locking remains harder to resolve than areas closer to land.
Same Region, Different Tsunami
The 1952 Mw 9.0 and 2025 Mw 8.8 earthquakes both involved the same long-term locked region, but their shallow slip differed. The paper argues that stronger near-trench slip in 1952 can explain the larger tsunami that year, while the 2025 rupture was concentrated more deeply and had more limited shallow slip, producing a smaller tsunami impact.
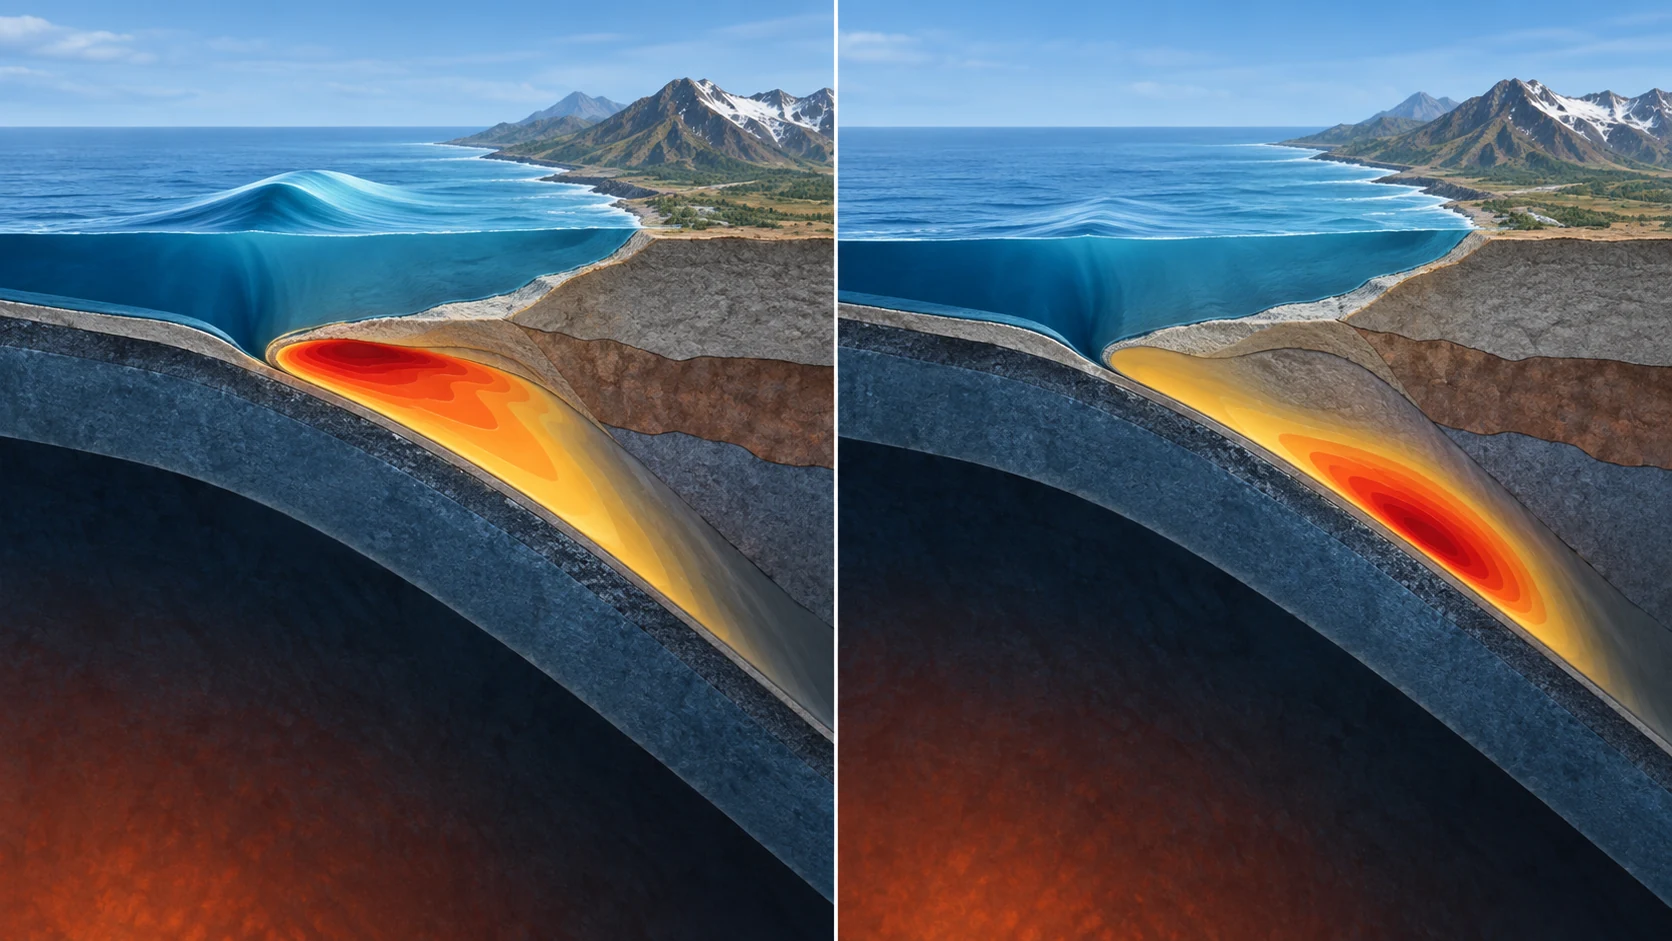
That contrast matters because knowing where strain has accumulated is not the same as knowing exactly how a rupture will travel along the entire fault. At roughly 80 millimetres per year, plate convergence between 1952 and 2025 would add about 5.8 metres of relative motion, yet parts of the 2025 event may have slipped more than 20 to 30 metres. The authors therefore discuss either incomplete strain release in 1952 or postseismic processes that reloaded the segment faster.
For preparedness, this distinction is critical. Locking probability can help forecast which part of a subduction zone is most likely to host a giant earthquake, but tsunami size also depends on whether rupture reaches the trench, how much shallow slip occurs, and how the seafloor deformation moves seawater. Many offshore fault zones still lack direct long-term measurements of those quantities.
From Kamchatka to Other Faults
The UCR release says the team is applying related location-forecasting methods to major subduction zones in Japan, Mexico, New Zealand and the Pacific Northwest, and is exploring whether similar ideas can help analyse California faults. The Hayward fault has both slowly creeping and locked sections, raising the question of whether surface deformation data can also flag the segments most likely to rupture.
The biggest bottleneck is still observation. Land GNSS stations provide long-term velocities, but many dangerous fault segments lie offshore. The shallow offshore interface is also one of the key controls on tsunami potential. Japan has begun using seafloor acoustic geodesy to track slow deformation over years; wider networks would give probabilistic locking models a stronger footing beyond retrospective tests.
The strongest message is therefore not that earthquake timing can now be predicted, but that likely giant-earthquake locations can be narrowed with better evidence than before. For communities, that can strengthen long-term land-use planning, tsunami evacuation design and infrastructure decisions. When shaking actually begins, preparedness still cannot be replaced by any single model.